MoneyLion to Participate in Upcoming Investor Conferences

MoneyLion to Participate in Upcoming Investor Conferences


MoneyLion to Participate in Upcoming Investor Conferences

NEW YORK–(BUSINESS WIRE)–MoneyLion Inc. (“MoneyLion”) (NYSE: ML), a leader in financial technology powering the next generation of personalized products and content, today announced its participation at the following investor conferences in May:


19th Annual Needham Technology, Media, & Consumer Conference

Attending: Thursday, May 16

Where: Virtual

B. Riley Securities 24th Annual Institutional Investor Conference

Attending: Wednesday, May 22 and Thursday, May 23

Where: Beverly Hills, CA

Craig-Hallum 21st Annual Institutional Investor Conference

Attending: Wednesday, May 29

Where: Minneapolis, MN

To receive additional information or to schedule a one-on-one meeting, please contact your conference representative or MoneyLion’s investor relations team at ir@moneylion.com.

About MoneyLion

MoneyLion is a leader in financial technology powering the next generation of personalized products and content, with a top consumer finance super app, a premier embedded finance platform for enterprise businesses and a world-class media arm. MoneyLion’s mission is to give everyone the power to make their best financial decisions. We pride ourselves on serving the many, not the few; providing confidence through guidance, choice, and personalization; and shortening the distance to an informed action. In our go-to money app for consumers, we deliver curated content on finance and related topics, through a tailored feed that engages people to learn and share. People take control of their finances with our innovative financial products and marketplace – including our full-fledged suite of features to save, borrow, spend, and invest – seamlessly bringing together the best offers and content from MoneyLion and our 1,100+ Enterprise Partner network, together in one experience.

MoneyLion’s enterprise technology provides the definitive search engine and marketplace for financial products, enabling any company to add embedded finance to their business, with advanced AI-backed data and tools through our platform and API. Established in 2013, MoneyLion connects millions of people with the financial products and content they need, when and where they need it.

For more information about MoneyLion, please visit www.moneylion.com. For information about Engine by MoneyLion for enterprise businesses, please visit www.engine.tech. For investor information and updates, visit investors.moneylion.com and follow @MoneyLionIR on X.

Contacts

Investor Relations

ir@moneylion.com
MoneyLion Communications

pr@moneylion.com

Pinnacle Bank Announces Earnings for First Quarter of 2024

Pinnacle Bank Announces Earnings for First Quarter of 2024


Pinnacle Bank Announces Earnings for First Quarter of 2024

GILROY, Calif.–(BUSINESS WIRE)–OTCQB: PBNK – Pinnacle Bank, headquartered in Gilroy, California, announced today unaudited net income for the three months ended March 31, 2024 of $2,453,000, compared to net income of $2,723,000 for the same period in 2023. The decrease in net income from the first quarter of 2023 reflects lower noninterest income, higher provision for credit losses and higher noninterest expenses exceeding higher net interest income.


As of March 31, 2024, total assets were $833.1 million, a 9% increase from the $766.6 million at March 31, 2023.

Gross loans were $576.8 million at March 31, 2024, a new record and an increase of $48.6 million (9%) from the March 31, 2023 balance of $528.2 million. The allowance for credit losses at March 31, 2024 was $6.225 million or 1.09% of net loans compared to $5.732 million or 1.10% of net loans at March 31, 2023.

Total deposits at March 31, 2024 were $727.4 million, a 8% increase from $676.3 million at March 31, 2023 and a 2% increase from $714.7 million at December 31, 2023.

Our markets continue to see good economic activity despite various challenges including higher interest rates and inflation. This quarter we saw loans grow to a new record as well as an increase in deposits. These achievements highlight the success of our approach to relationship banking and our high level of personalized service,” stated Jeffrey Payne, President and CEO. “We are honored to contribute to the success of our communities by providing premier business banking from Salinas Valley to Silicon Valley. We appreciate the ongoing efforts of our outstanding team of professional bankers, committed directors and advisors and our many loyal clients that contribute to our ongoing success and valued relationships.”

The Bank’s capital position remains above regulatory guidelines for well capitalized banks. At March 31, 2024, the Bank had a total capital ratio of 15.01%. Book value per share at March 31, 2024 was $15.64.

Pinnacle Bank is rated by Bauer Financial as Five-Star “Superior” for strong financial performance, the top rating given by the independent bank rating firm. DepositAccounts.com awarded Pinnacle Bank an A health rating. The Findley Reports named Pinnacle Bank a 2023 Super Premier performing bank.

For more information, please go to www.pinnacle.bank click on Investor Relations and March 2024 call report.

About Pinnacle Bank

Pinnacle Bank is a full-service business bank dedicated to providing quality depository and credit services in Santa Clara, San Benito and Monterey counties. The bank focuses on commercial banking services for businesses and nonprofit organizations, offering a variety of products and services that combine the best of personal touch with convenient technology-based delivery. Pinnacle Bank has locations in Morgan Hill, Gilroy, Salinas and Campbell. For more information, please go to www.pinnacle.bank click on Investor Relations and March 2024 call report.

Forward-Looking Statements

This release may contain forward-looking statements, such as, among others, statements about plans, expectations and goals concerning growth and improvement. Forward-looking statements are subject to risks and uncertainties. Such risks and uncertainties may include but are not necessarily limited to fluctuations in interest rates, inflation, government regulations and general economic conditions, including the real estate market in our primary service area and more generally in California and other factors beyond the Bank’s control. Such risks and uncertainties could cause results for subsequent interim periods or for the entire year to differ materially from those indicated. Readers should not place undue reliance on the forward-looking statements, which reflect management’s view only as of the date hereof. Pinnacle Bank undertakes no obligation to publicly revise these forward-looking statements to reflect subsequent events or circumstances.

Summary Balance Sheet


Year over year change

(Unaudited, dollars in thousands)

3/31/2024

12/31/2023

3/31/2023

$

%

Total assets

$

833,081


$

817,420


$

766,638


$

66,443


9

%

Gross loans

$

576,784


$

564,454


$

528,159


$

48,625


9

%

Allowance for loan losses

$

(6,225

)

$

(5,952

)

$

(5,732

)

$

(493

)

9

%

Non-interest bearing deposits

$

248,792


$

262,757


$

275,224


$

(26,432

)

-10

%

Interest-bearing deposits

$

478,599


$

451,961


$

401,071


$

77,528


19

%

Total deposits

$

727,391


$

714,718


$

676,295


$

51,096


8

%

Shareholders’ equity

$

91,245


$

87,926


$

77,076


$

14,169


18

%

Summary Income Statement


(Unaudited, dollars in thousands

Quarter ended

Quarter ended

Change

Quarter ended

Change

except per share data)

3/31/2024

12/31/2023

%

3/31/2023

%

Interest income

$

12,823

$

12,478

3

%

$

10,602

21

%

Interest expense


3,190


3,018

6

%


1,604

99

%

Net interest income


9,633


9,460

2

%


8,998

7

%

Provision for loan losses


306


144

113

%


136

125

%

Non-interest income


529


1,276

-59

%


1,161

-54

%

Non-interest expense


6,451


5,999

8

%


6,277

3

%

Income tax expense


952


1,340

-29

%


1,023

-7

%

Net income (loss)

$

2,453

$

3,252

-25

%

$

2,723

-10

%


Basic Earnings per share

$

0.42

$

0.57

-26

%

$

0.49

-14

%

Diluted Earnings per share

$

0.42

$

0.56

-25

%

$

0.48

-13

%

Book value per share

$

15.64

$

15.37

2

%

$

13.67

14

%

Shares outstanding at period end


5,833,976


5,721,976

2

%


5,637,148

3

%


Minimum


required to be


Capital Ratios

3/31/2024

12/31/2023

3/31/2023

well-capitalized


Tier 1 leverage ratio

11.27

%

10.72

%

10.23

%

5.00

%


Common Equity Tier 1 capital ratio

14.06

%

13.72

%

12.97

%

6.50

%


Tier 1 capital ratio

14.06

%

13.72

%

12.97

%

8.00

%


Total capital ratio

15.01

%

14.64

%

13.91

%

10.00

%


Contacts

Pinnacle Bank
Jeffrey D. Payne, President & CEO
408-762-7146

KBRA Comments on Amendment to Momnt Technologies Trust 2023-1

KBRA Comments on Amendment to Momnt Technologies Trust 2023-1


KBRA Comments on Amendment to Momnt Technologies Trust 2023-1

NEW YORK–(BUSINESS WIRE)–#creditratingagency–On April 19, 2024, Momnt Technologies Trust 2023-1 (“MMNT 2023-1” or the “Trust”), a home improvement loan ABS transaction, was amended to allow for the conveyance of approximately $8.09 million of additional collateral (“Additional Collateral”) into the Trust.


Momnt Technologies Inc. (“Momnt” or the “Company”) was founded in 2019 and is a financial technology company headquartered in Atlanta, GA. The Momnt 2023-1 transaction initially closed on December 22, 2023. The portfolio balance as of the Initial Cut-off Date was expected to be approximately $150.9 million, consisting of an aggregate principal balance of the initial receivable pool of approximately $90.1 million plus an expected prefunding account balance to be deposited on the closing date of approximately $60.8 million. The transaction had a 90-day prefunding period, that expired on March 18, 2024.

The amendment was to address a collateral shortfall that was first discovered after the first Payment Date in February 2024 and caused by the purchase of collateral during the prefunding period at an amount exceeding the specified amount required in the transaction documents and an overestimation of the collateral at closing. Regarding the former, on the closing date approximately $60.8 million was deposited into the prefunding account, which was used to purchase additional collateral during the prefunding period. According to the Indenture, loans acquired by the Trust during the prefunding period were required to be purchased at the principal balance of such loan as of the applicable cutoff date. However, the purchase price incorrectly included accrued finance charges and fees into the principal balance.

The application of cash and loan acquisitions were the responsibility of the Administrator, Saluda Grade Asset Management, LLC. The Sponsor added the Additional Collateral on April 19, 2024 to address the collateral shortfall, and bring the credit enhancement to the approximate level that would have been achieved if the prefunding proceeds had been appropriately utilized to acquire collateral at par and the open-to-buy shortfall had been discovered at closing. The below table shows the credit enhancement of each rated class of notes at closing, before the conveyance of Additional Collateral (as of the March 2024 Distribution Date for the February 2024 Collection Period), and on a proforma basis after the conveyance of Additional Collateral (as of the March 2024 Distribution Date for the February 2024 Collection Period).

Approximately $90.1 million of collateral, as of the closing date, was outside the purchase window, implying that borrowers no longer had the ability to make further draws (the “open-to-buy” limit). A borrower’s open-to-buy limit is a closed-ended credit limit Momnt assigns a borrower, which the borrower can use to make purchases during a purchase window (typically the earlier of five months or whenever the borrower utilizes their entire open-to-buy limit). However, approximately $4.6 million of the $90.1 million was never drawn on by borrowers during their purchase window. This shortfall was not identified by the Sponsor or Momnt at closing. Therefore, the $4.6 million never materialized as collateral and the portfolio balance as of the Initial Cut-off Date was approximately $4.6 million less than expected.

KBRA has been in dialogue with the Sponsor and Momnt, which indicated that the administrative processes that led to the issues herein were due to misinterpretation of purchase price for each subsequent receivable acquired by the Trust during the prefunding period, as well as an oversight regarding the final principal balance at closing. Given the transaction is outside of the prefunding period and all collateral, including Additional Collateral, is outside the purchase window, KBRA believes this issue has been remediated for the Momnt 2023-1 transaction going forward.

A review of the Additional Collateral and that of the remaining pool indicated the credit quality of the collateral is generally commensurate with that of the collateral on the Closing Date. Furthermore, the credit enhancement levels of each class have increased since closing. KBRA is not effectuating rating actions at this time, and will continue to monitor the situation in conjunction with its ongoing surveillance effort. Should further administrative issues arise it may result in Watch Placements or rating actions.

Related Publications

About KBRA

KBRA is a full-service credit rating agency registered in the U.S., the EU, and the UK, and is designated to provide structured finance ratings in Canada. KBRA’s ratings can be used by investors for regulatory capital purposes in multiple jurisdictions.

Doc ID: 1004090

Contacts

Maxim Berger, Director

+1 646-731-1260

maxim.berger@kbra.com

Juhi Paranjape, Senior Analyst

+1 646-731-1340

juhi.paranjape@kbra.com

Eric Neglia, Head of Commercial and Consumer ABS

+1 646-731-2456

eric.neglia@kbra.com

Business Development Contact

Arielle Smelkinson, Senior Director

+1 646-731-2369

arielle.smelkinson@kbra.com

Westphalia Dev. Corp. Reports Fiscal Year and Fourth Quarter 2023 Fiscal Results

Westphalia Dev. Corp. Reports Fiscal Year and Fourth Quarter 2023 Fiscal Results


Westphalia Dev. Corp. Reports Fiscal Year and Fourth Quarter 2023 Fiscal Results

SCOTTSDALE, Ariz.–(BUSINESS WIRE)–Westphalia Dev. Corp. (the “Corporation”) announced today its results for the fiscal year and fourth quarter ending December 31, 2023. The Corporation was formed in March 2012, for the development of a 310-acre Westphalia property located in Prince George’s County, Maryland, United States. The Corporation is managed by Walton Global (the “Manager”).


Development and Sales Activities

  • The Westphalia Interchange TIF project located at the intersection of Pennsylvania Avenue (Route 4) and Woodyard Route (Route 223) is substantially complete.
  • The Presidential Parkway East TIF project is substantially complete. We are in discussions with the local County for final acceptance.
  • The Presidential Parkway West TIF project has work remaining, which will likely be completed in Q2, 2024.
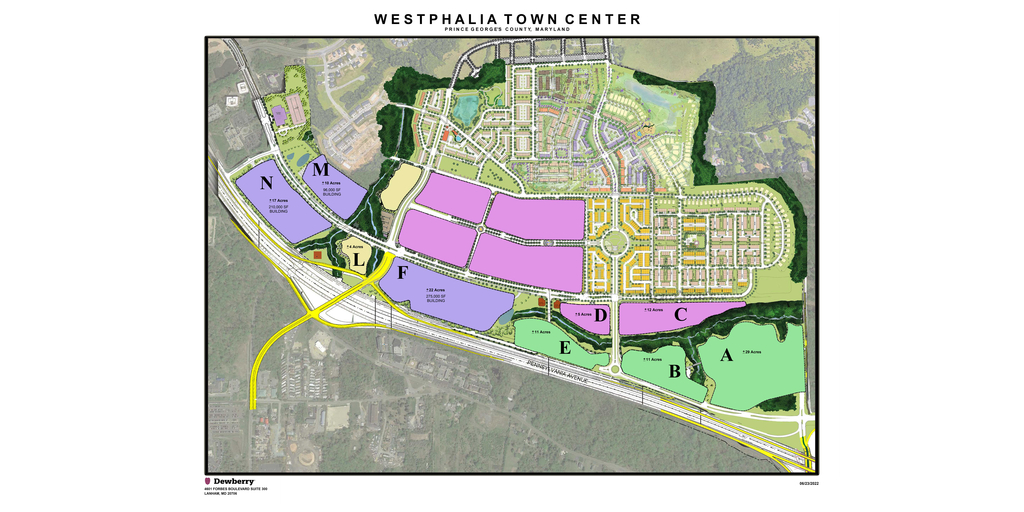
  • The Manager is engaged with a number of builders interested in developing and building out the retail and/or residential lettered pods shown above. Offers to purchase are expected on these parcels imminently.
  • The Manager received infrastructure approval from Prince George’s County for our retail commercial, mixed use commercial and residential pods shown as Parcel “A” & “B”.

Financial Results

  • Management has determined the substantial completion date of Phase 1 to be June 30, 2023, at which point carrying costs, including interest, financing costs and property taxes, will no longer be capitalized and are now expensed. Otherwise, other operating expenses for this quarter remained consistent with Q3 2023.

The Corporation’s audited consolidated financial statements and management’s discussion and analysis for the year ended December 31, 2023, are available under the Corporation’s SEDAR profile at www.sedar.com.

About Walton Global

Walton Global is a privately-owned, leading land asset management and global real estate investment company that concentrates on the research, acquisition, administration, planning, and development of land. With more than 45 years of experience, Walton has a proven track record of administering land investment projects within the fastest growing metropolitan areas in North America. The company manages and administers US$4.37 billion in assets on behalf of its global investors, builders and developer clients and industry business partners. Walton has more than 90,000 acres of land under ownership, management and administration in the United States and Canada with business lines ranging from exit-focused pre-development land investments, builder land financing and build-to-rent. For more information visit walton.com.

This news release, required by Canadian laws, does not constitute an offer of securities, and is not for distribution or dissemination outside Canada. This news release contains forward looking information, and actual future results may differ from what is disclosed in this news release. Forward-looking information is based on the current expectations, estimates and projections of the Corporation at the time the statements are made. They involve a number of known and unknown risks and uncertainties which would cause actual results or events to differ materially from those presently anticipated. The risks, uncertainties and other factors that could cause the Corporation’s actual results and performance in future periods to differ materially from the forward looking information contained in this news release include, among other things, the development of Westphalia Town Center, general economic and market factors, including interest rates, a decline in the real estate market, changes in government policies and regulations or in tax laws, changes in municipal planning strategies and whether certain development approvals are obtained and changes in the Canadian/U.S. dollar exchange rate, in addition to those factors discussed or referenced in documents filed with Canadian securities regulatory authorities and available online at www.sedar.com.

Except as otherwise noted, all amounts are in Canadian dollars, and are based on audited consolidated financial statements for the year ended December 31, 2023, and related notes, prepared in accordance with International Financial Reporting Standards.

Contacts

MEDIA CONTACT:

Allison+Partners

waltonglobal@allisonpr.com

Customers Bancorp Reports Results for First Quarter

Customers Bancorp Reports Results for First Quarter


Customers Bancorp Reports Results for First Quarter

WEST READING, Pa.–(BUSINESS WIRE)–$CUBI #banking–Customers Bancorp, Inc. (NYSE:CUBI):

First Quarter 2024 Highlights

  • Q1 2024 net income available to common shareholders was $45.9 million, or $1.40 per diluted share; ROAA was 0.94% and ROCE was 12.08%.
  • Q1 2024 core earnings* were $46.5 million, or $1.42 per diluted share; Core ROAA* was 0.95% and Core ROCE* was 12.24%.
  • Q1 2024 adjusted core earnings* excluding certain one-time items were $55.1 million, or $1.68 per diluted share; Adjusted Core ROAA* excluding certain one-time items was 1.11% and Adjusted Core ROCE* excluding certain one-time items was 14.50%.
  • CET 1 ratio of 12.5%1 at March 31, 2024, compared to 12.2% at December 31, 2023, above the approximately 11.5% target.
  • TCE / TA ratio* of 7.3% at March 31, 2024, compared to 7.0% at December 31, 2023, on track to achieve 7.5% target within one to two quarters.
  • Q1 2024 net interest margin, tax equivalent (“NIM”) was 3.10%, compared to Q4 2023 NIM of 3.31%, due to higher cash balances and lower average loans during the quarter.
  • Total deposits increased by $41.1 million in Q1 2024 from Q4 2023 with a significant positive mix shift. Q1 2024 business unit deposit*2 growth of $1.2 billion funded the repayment of maturing wholesale CDs of $1.2 billion.
  • Non-interest bearing deposits increased by $266.4 million in Q1 2024 from Q4 2023 and represented 26% of total deposits.
  • Total estimated insured deposits were 78%3 of total deposits at March 31, 2024, with immediately available liquidity covering estimated uninsured deposits3 by approximately 224%.
  • Non-performing assets were $35.8 million, or 0.17% of total assets, at March 31, 2024 compared to 0.13% at December 31, 2023. Allowance for credit losses on loans and leases equaled 374% of non-performing loans at March 31, 2024, compared to 499% at December 31, 2023.
  • Q1 2024 provision for credit losses on loans and leases was $16.0 million compared to $13.4 million in Q4 2023 and the coverage of credit loss reserves for loans and leases held for investment was 1.12%. The coverage of credit loss reserves for loans and leases held for investment decreased modestly from 1.13% in Q4 2023 largely driven by lower consumer installment loans held for investment.
  • Q1 2024 book value per share and tangible book value per share* both grew by approximately $1.56, or 3.3% over Q4 2023, driven by strong quarterly earnings and a decrease in AOCI losses of $4.3 million over the same time period.

______________________________________________

*

Non-GAAP measure. Customers’ reasons for the use of the non-GAAP measure and a detailed reconciliation between the non-GAAP measure and the comparable GAAP amount are included at the end of this document.

1

Regulatory capital ratios as of March 31, 2024 are estimates.

2

Total deposits excluding wholesale CDs and BMTX student-related deposits.

3

Uninsured deposits (estimate) of $5.2 billion to be reported on the Bank’s call report, less deposits of $1.1 billion collateralized by standby letters of credit from the FHLB and from our affiliates of $124.5 million.

CEO Commentary

“Following an exceptional year in 2023, we are pleased to share continued progress on the execution of our strategic priorities which we believe will grow our franchise value, our margins and net interest income in 2024 and beyond,” said Customers Bancorp Chairman and CEO Jay Sidhu. “We are excited to announce that in April we welcomed 10 new, very experienced, banking teams to Customers Bank that are commercial focused deposit generators in the New York metropolitan area and in selected markets in California and Nevada. These commercial and business banking teams are highly experienced, have worked together for decades and have longstanding and deep client relationships. We expect the addition of these teams to accelerate the continued improvement of our deposit franchise with low cost, granular, primary relationship-based deposit accounts. We look forward to delivering exceptional service to their clients with our single point of contact, high-touch, technology-enabled banking capabilities. In the quarter, we once again demonstrated the momentum of our deposit franchise transformation by growing business unit deposits*2 by $1.2 billion which funded the repayment of maturing wholesale CDs in the amount of $1.2 billion. This was our fourth consecutive quarter of approximately $1 billion of business unit deposit*2 growth. The business unit deposit*2 growth was, once again, broad-based with more than 20 different channels increasing balances and roughly half contributing $25 million or more. Non-interest bearing deposits increased by $266.4 million during the quarter and represented 26 percent of total deposits. Our net interest margin moderated in the first quarter to 3.10% driven primarily by elevated cash balances resulting from strong business unit deposit*2 growth and the timing associated with replenishing higher yielding interest-earning assets that exited in the fourth quarter as we continue to remain focused on loan growth supporting holistic relationships. Capital levels continued to build as evidenced by a 24 basis point increase in our TCE / TA ratio* and an increase in our CET 1 ratio to 12.5%1. We are confident in our ability to achieve the 7.5% TCE / TA ratio* target that we disclosed last quarter. Enhanced by the addition of our new banking teams, we believe we are extremely well-positioned to continue to strengthen our deposit franchise, improve our profitability, and maintain our already strong capital ratios,” stated Jay Sidhu.

“Our Q1 2024 GAAP earnings were $45.9 million, or $1.40 per diluted share, and core earnings* were $46.5 million, or $1.42 per diluted share. Excluding certain one-time items incurred during the quarter, our adjusted core earnings* were $55.1 million, or $1.68 per diluted share. At March 31, 2024, our deposit base was well diversified, with approximately 78%3 of total deposits insured. We maintain a strong liquidity position, with $8.9 billion of liquidity immediately available, which covers approximately 224% of uninsured deposits3 and our loan to deposit ratio was 74%. We continue to focus loan production where we have a holistic and primary relationship. Commercial loans grew by $123.0 million though gross loan balances remained relatively flat given targeted reductions in consumer installment loans in the quarter. Our loan pipeline grew meaningfully through the first quarter, and we remain confident in the 10% – 15% loan growth outlook previously provided. We have ample liquidity and capital to support the needs of our customers. At March 31, 2024, we had $3.7 billion of cash on hand, to fund strategic loan growth as well as prudent balance sheet and liquidity management. Asset quality remains strong with our NPA ratio at just 0.17% of total assets and reserve levels are robust at over 370% of total non-performing loans at the end of Q1 2024. Our exposure to the higher risk commercial real estate office sector is minimal, representing approximately 1% of the loan portfolio. Continued execution on our strategic priorities has positioned us favorably for success in 2024 from a capital, credit, liquidity, interest rate risk and earnings perspective. We will remain disciplined, but opportunistic, with our balance sheet capacity to manage risk and maintain robust capital levels. We are confident in our risk management capabilities and ability to provide excellent and differentiated service to our clients. We are excited and optimistic about the opportunities we had entering 2024, which will only be enhanced by the addition of the new banking teams,” Jay Sidhu continued.

______________________________________________

*

Non-GAAP measure. Customers’ reasons for the use of the non-GAAP measure and a detailed reconciliation between the non-GAAP measure and the comparable GAAP amount are included at the end of this document.

1

Regulatory capital ratios as of March 31, 2024 are estimates.

2

Total deposits excluding wholesale CDs and BMTX student-related deposits.

3

Uninsured deposits (estimate) of $5.2 billion to be reported on the Bank’s call report, less deposits of $1.1 billion collateralized by standby letters of credit from the FHLB and from our affiliates of $124.5 million.

Financial Highlights

(Dollars in thousands, except per share data)


At or Three Months Ended


Increase (Decrease)


March 31, 2024


December 31, 2023


Profitability Metrics:


Net income available for common shareholders


$

45,926


$

58,223


$

(12,297

)


(21.1

)%

Diluted earnings per share


$

1.40


$

1.79


$

(0.39

)


(21.8

)%

Core earnings*


$

46,532


$

61,633


$

(15,101

)


(24.5

)%

Adjusted core earnings*


$

55,137


$

61,633


$

(6,496

)


(10.5

)%

Core earnings per share*


$

1.42


$

1.90


$

(0.48

)


(25.3

)%

Adjusted core earnings per share*


$

1.68


$

1.90


$

(0.22

)


(11.6

)%

Return on average assets (“ROAA”)


0.94

%


1.16

%


(0.22

)


Core ROAA*


0.95

%


1.22

%


(0.27

)


Adjusted core ROAA*


1.11

%


1.22

%


(0.11

)


Return on average common equity (“ROCE”)


12.08

%


15.93

%


(3.85

)


Core ROCE*


12.24

%


16.87

%


(4.63

)


Adjusted core ROCE*


14.50

%


16.87

%


(2.37

)


Core pre-tax pre-provision net income*


$

83,674


$

101,884


$

(18,210

)


(17.9

)%

Adjusted core pre-tax pre-provision net income*


$

94,988


$

101,884


$

(6,896

)


(6.8

)%

Net interest margin, tax equivalent


3.10

%


3.31

%


(0.21

)


Yield on loans (Loan yield)


7.05

%


7.30

%


(0.25

)


Cost of deposits


3.45

%


3.39

%


0.06


Efficiency ratio


54.58

%


49.08

%


5.50


Core efficiency ratio*


54.24

%


46.70

%


7.54


Adjusted core efficiency ratio*


48.02

%


46.70

%


1.32


Non-interest expense to average total assets


1.87

%


1.75

%


0.12


Core non-interest expense to average total assets*


1.86

%


1.67

%


0.19


Adjusted core non-interest expense to average total assets*


1.65

%


1.67

%


(0.02

)


Balance Sheet Trends:


Total assets


$

21,347,367


$

21,316,265


$

31,102


0.1

%

Total cash and investment securities


$

7,338,025


$

7,355,156


$

(17,131

)


(0.2

)%

Total loans and leases


$

13,256,871


$

13,202,084


$

54,787


0.4

%

Non-interest bearing demand deposits


$

4,688,880


$

4,422,494


$

266,386


6.0

%

Total deposits


$

17,961,383


$

17,920,236


$

41,147


0.2

%

Capital Metrics:


Common Equity


$

1,553,823


$

1,500,600


$

53,223


3.5

%

Tangible Common Equity*


$

1,550,194


$

1,496,971


$

53,223


3.6

%

Common Equity to Total Assets


7.3

%


7.0

%


0.3


Tangible Common Equity to Tangible Assets*


7.3

%


7.0

%


0.3


Book Value per common share


$

49.29


$

47.73


$

1.56


3.3

%

Tangible Book Value per common share*


$

49.18


$

47.61


$

1.57


3.3

%

Common equity Tier 1 capital ratio (1)


12.5

%


12.2

%


0.3


Total risk based capital ratio (1)


15.6

%


15.3

%


0.3


(1) Regulatory capital ratios as of March 31, 2024 are estimates.

* Non-GAAP measure. Customers’ reasons for the use of the non-GAAP measure and a detailed reconciliation between the non-GAAP measure and the comparable GAAP amount are included at the end of this document.

Financial Highlights

(Dollars in thousands, except per share data)


At or Three Months Ended


Increase (Decrease)


March 31, 2024


March 31, 2023


Profitability Metrics:


Net income available for common shareholders


$

45,926


$

50,265


$

(4,339

)


(8.6

)%

Diluted earnings per share


$

1.40


$

1.55


$

(0.15

)


(9.7

)%

Core earnings*


$

46,532


$

51,143


$

(4,611

)


(9.0

)%

Adjusted core earnings*


$

55,137


$

51,143


$

3,994


7.8

%

Core earnings per share*


$

1.42


$

1.58


$

(0.16

)


(10.1

)%

Adjusted core earnings per share*


$

1.68


$

1.58


$

0.10


6.3

%

Return on average assets (“ROAA”)


0.94

%


1.03

%


(0.09

)


Core ROAA*


0.95

%


1.05

%


(0.10

)


Adjusted core ROAA*


1.11

%


1.05

%


0.06


Return on average common equity (“ROCE”)


12.08

%


16.00

%


(3.92

)


Core ROCE*


12.24

%


16.28

%


(4.04

)


Adjusted core ROCE*


14.50

%


16.28

%


(1.78

)


Core pre-tax pre-provision net income*


$

83,674


$

89,282


$

(5,608

)


(6.3

)%

Adjusted core pre-tax pre-provision net income*


$

94,988


$

89,282


$

5,706


6.4

%

Net interest margin, tax equivalent


3.10

%


2.96

%


0.14


Yield on loans (Loan yield)


7.05

%


6.70

%


0.35


Cost of deposits


3.45

%


3.32

%


0.13


Efficiency ratio


54.58

%


47.71

%


6.87


Core efficiency ratio*


54.24

%


47.09

%


7.15


Adjusted core efficiency ratio*


48.02

%


47.09

%


0.93


Non-interest expense to average total assets


1.87

%


1.54

%


0.33


Core non-interest expense to average total assets*


1.86

%


1.53

%


0.33


Adjusted core non-interest expense to average total assets*


1.65

%


1.53

%


0.12


Balance Sheet Trends:


Total assets


$

21,347,367


$

21,751,614


$

(404,247

)


(1.9

)%

Total cash and investment securities


$

7,338,025


$

5,843,948


$

1,494,077


25.6

%

Total loans and leases


$

13,256,871


$

15,063,034


$

(1,806,163

)


(12.0

)%

Non-interest bearing demand deposits


$

4,688,880


$

3,487,517


$

1,201,363


34.4

%

Total deposits


$

17,961,383


$

17,723,617


$

237,766


1.3

%

Capital Metrics:


Common Equity


$

1,553,823


$

1,283,226


$

270,597


21.1

%

Tangible Common Equity*


$

1,550,194


$

1,279,597


$

270,597


21.1

%

Common Equity to Total Assets


7.3

%


5.9

%


1.4


Tangible Common Equity to Tangible Assets*


7.3

%


5.9

%


1.4


Book Value per common share


$

49.29


$

41.08


$

8.21


20.0

%

Tangible Book Value per common share*


$

49.18


$

40.96


$

8.22


20.1

%

Common equity Tier 1 capital ratio (1)


12.5

%


9.6

%


2.9


Total risk based capital ratio (1)


15.6

%


12.3

%


3.3


(1) Regulatory capital ratios as of March 31, 2024 are estimates.

* Non-GAAP measure. Customers’ reasons for the use of the non-GAAP measure and a detailed reconciliation between the non-GAAP measure and the comparable GAAP amount are included at the end of this document.

Key Balance Sheet Trends

Loans and Leases

The following table presents the composition of total loans and leases as of the dates indicated:

(Dollars in thousands)

March 31, 2024


% of Total


December 31, 2023


% of Total


March 31, 2023


% of Total

Loans and Leases Held for Investment


Commercial:


Commercial & industrial:


Specialized lending

$

5,104,405


39.6

%


$

5,006,693


38.9

%


$

5,519,176


37.7

%

Other commercial & industrial (1)


1,113,517


8.6


1,162,317


9.0


1,414,419


9.7


Mortgage finance


1,071,146


8.3


1,014,742


7.9


1,374,894


9.4


Multifamily


2,123,675


16.5


2,138,622


16.6


2,195,211


15.0


Commercial real estate owner occupied


806,278


6.3


797,319


6.2


895,314


6.1


Commercial real estate non-owner occupied


1,182,084


9.2


1,177,650


9.2


1,245,248


8.5


Construction


185,601


1.3


166,393


1.3


188,123


1.3


Total commercial loans and leases


11,586,706


89.8


11,463,736


89.1


12,832,385


87.7


Consumer:


Residential


482,537


3.8


484,435


3.8


494,815


3.4


Manufactured housing


37,382


0.3


38,670


0.3


43,272


0.3


Installment:


Personal


492,892


3.8


555,533


4.3


849,420


5.8


Other


299,714


2.3


319,393


2.5


419,085


2.8


Total installment loans


792,606


6.1


874,926


6.8


1,268,505


8.6


Total consumer loans


1,312,525


10.2


1,398,031


10.9


1,806,592


12.3


Total loans and leases held for investment

$

12,899,231


100.0

%


$

12,861,767


100.0

%


$

14,638,977


100.0

%


Loans Held for Sale


Commercial:


Multifamily

$


%


$


%


$

4,051


1.0

%

Commercial real estate non-owner occupied


16,000


3.7


Total commercial loans and leases


20,051


4.7


Consumer:


Residential


870


0.2


1,215


0.3


821


0.2


Installment:


Personal


137,755


38.5


151,040


44.4


307,336


72.5


Other


219,015


61.3


188,062


55.3


95,849


22.6


Total installment loans


356,770


99.8


339,102


99.7


403,185


95.1


Total consumer loans


357,640


100.0


340,317


100.0


404,006


95.3


Total loans held for sale

$

357,640


100.0

%


$

340,317


100.0

%


$

424,057


100.0

%


Total loans and leases portfolio

$

13,256,871


$

13,202,084


$

15,063,034


(1) Includes PPP loans of $52.0 million, $74.7 million and $246.3 million as of March 31, 2024, December 31, 2023 and March 31, 2023, respectively.

Loans and Leases Held for Investment

Loans and leases held for investment were $12.9 billion at March 31, 2024, up $37.5 million, or 0.3%, from December 31, 2023. Specialized lending increased $97.7 million, or 2.0% quarter-over-quarter, to $5.1 billion. Mortgage finance loans increased $56.4 million, or 5.6% quarter-over-quarter due to higher mortgage activity. Construction loans increased $19.2 million, or 11.5% quarter-over-quarter, to $185.6 million. Consumer installment loans held for investment decreased $82.3 million, or 9.4% quarter-over-quarter, to $792.6 million due to the continued build out of the held-for-sale strategy and de-risking of the held-for-investment loan portfolio. Other commercial and industrial loans decreased $48.8 million, or 4.2% quarter-over-quarter, to $1.1 billion, which included a decrease in PPP loans primarily from guarantee payments.

Loans and leases held for investment of $12.9 billion at March 31, 2024 was down $1.7 billion, or 11.9%, year-over-year, largely driven by reduced balances in consumer installment loans of $475.9 million, or 37.5% year-over-year, specialized lending of $414.8 million, mortgage finance loans of $303.7 million and other commercial and industrial loans of $300.9 million, which included a decrease in PPP loans primarily from guarantee payments.

Loans Held for Sale

Loans held for sale increased $17.3 million quarter-over-quarter, and were $357.6 million at March 31, 2024 due to the continued build out of the held-for-sale strategy in 2024.

Allowance for Credit Losses on Loans and Leases

The following table presents the allowance for credit losses on loans and leases as of the dates and for the periods presented:


At or Three Months Ended


Increase (Decrease)


At or Three Months Ended


Increase (Decrease)

(Dollars in thousands)

March 31, 2024


December 31, 2023


March 31, 2024


March 31, 2023


Allowance for credit losses on loans and leases

$

133,296


$

135,311


$

(2,015

)


$

133,296


$

130,281


$

3,015


Provision (benefit) for credit losses on loans and leases

$

15,953


$

13,420


$

2,533


$

15,953


$

18,008


$

(2,055

)

Net charge-offs from loans held for investment

$

17,968


$

17,322


$

646


$

17,968


$

18,651


$

(683

)

Annualized net charge-offs to average loans and leases


0.55

%


0.51

%


0.55

%


0.49

%


Coverage of credit loss reserves for loans and leases held for investment


1.12

%


1.13

%


1.12

%


0.97

%


Net charge-offs were relatively stable with $18.0 million in Q1 2024, compared to $17.3 million in Q4 2023 and $18.7 million in Q1 2023.

Provision (benefit) for Credit Losses


Three Months Ended


Increase (Decrease)


Three Months Ended


Increase (Decrease)

(Dollars in thousands)

March 31, 2024


December 31, 2023


March 31, 2024


March 31, 2023


Provision (benefit) for credit losses on loans and leases

$

15,953


$

13,420


$

2,533


$

15,953


$

18,008


$

(2,055

)

Provision (benefit) for credit losses on available for sale debt securities


1,117


103


1,014


1,117


1,595


(478

)

Provision for credit losses


17,070


13,523


3,547


17,070


19,603


(2,533

)

Provision (benefit) for credit losses on unfunded commitments


430


(136

)


566


430


280


150


Total provision for credit losses

$

17,500


$

13,387


$

4,113


$

17,500


$

19,883


$

(2,383

)

The provision for credit losses on loans and leases in Q1 2024 was $16.0 million, compared to $13.4 million in Q4 2023. The higher provision in Q1 2024 was primarily due to increased uncertainty and slightly weaker macroeconomic forecasts, partially offset by lower balances in consumer installment loans held for investment.

The provision for credit losses on available for sale investment securities in Q1 2024 was $1.1 million, compared to provision of $0.1 million in Q4 2023.

The provision for credit losses on loans and leases in Q1 2024 was $16.0 million, compared to $18.0 million in Q1 2023. The lower provision in Q1 2024 compared to the year ago period was primarily due to lower balances in loans held for investment.

The provision for credit losses on available for sale investment securities in Q1 2024 was $1.1 million compared to provision of $1.6 million in Q1 2023.

Asset Quality

The following table presents asset quality metrics as of the dates indicated:

(Dollars in thousands)

March 31, 2024


December 31, 2023


Increase (Decrease)


March 31, 2024


March 31, 2023


Increase (Decrease)

Non-performing assets (“NPAs”):


Nonaccrual / non-performing loans (“NPLs”)

$

35,654


$

27,110


$

8,544


$

35,654


$

32,124


$

3,530


Non-performing assets

$

35,753


$

27,209


$

8,544


$

35,753


$

32,260


$

3,493


NPLs to total loans and leases


0.27

%


0.21

%


0.27

%


0.21

%


Reserves to NPLs


373.86

%


499.12

%


373.86

%


405.56

%


NPAs to total assets


0.17

%


0.13

%


0.17

%


0.15

%


Loans and leases (1) risk ratings:


Commercial loans and leases


Pass

$

10,095,611


$

9,955,243


$

140,368


$

10,095,611


$

10,928,620


$

(833,009

)

Special Mention


194,365


196,182


(1,817

)


194,365


136,986


57,379


Substandard


282,163


339,664


(57,501

)


282,163


273,154


9,009


Total commercial loans and leases


10,572,139


10,491,089


81,050


10,572,139


11,338,760


(766,621

)

Consumer loans


Performing


1,293,457


1,379,603


(86,146

)


1,293,457


1,787,123


(493,666

)

Non-performing


19,068


18,428


640


19,068


19,469


(401

)

Total consumer loans


1,312,525


1,398,031


(85,506

)


1,312,525


1,806,592


(494,067

)

Loans and leases receivable (1)

$

11,884,664


$

11,889,120


$

(4,456

)


$

11,884,664


$

13,145,352


$

(1,260,688

)


(1) Risk ratings are assigned to loans and leases held for investment, and excludes loans held for sale, loans receivable, mortgage finance, at fair value and eligible PPP loans that are fully guaranteed by the Small Business Administration.

Over the last decade, the Bank has developed a suite of commercial loan products with one particularly important common denominator: relatively low credit risk assumption. The Bank’s commercial and industrial (“C&I”), mortgage finance, corporate and specialized lending lines of business, and multifamily loans for example, are characterized by conservative underwriting standards and low loss rates. Because of this emphasis, the Bank’s credit quality to date has been incredibly healthy despite an adverse economic environment. Maintaining strong asset quality also requires a highly active portfolio monitoring process. In addition to frequent client outreach and monitoring at the individual loan level, management employs a bottom-up data driven approach to analyze the commercial portfolio.

Total consumer installment loans held for investment at March 31, 2024 were less than 4% of total assets and approximately 6% of total loans and leases held for investment, and were supported by an allowance for credit losses of $50.7 million. At March 31, 2024, the consumer installment portfolio had the following characteristics: average original FICO score of 737, average debt-to-income of 20% and average borrower income of $107 thousand.

Contacts

David W. Patti, Communications Director 610-451-9452

Read full story here

enosix, Inc. Opens New European Headquarters in Munich, Germany

enosix, Inc. Opens New European Headquarters in Munich, Germany


enosix, Inc. Opens New European Headquarters in Munich, Germany

MUNICH–(BUSINESS WIRE)–enosix, Inc., the leading technology provider of real-time, prebuilt SAP process integration solutions, is thrilled to announce the opening of its EMEA Headquarters in Munich on April 25th. This strategic move reaffirms enosix’s commitment to revolutionizing real-time SAP data and business process accessibility across organizations’ critical systems to ensure superior business outcomes globally.


As the sole solution delivering 100% real-time SAP data experiences, enosix recognizes Munich as a pivotal market for delivering localized support to both customers and front-end partners. The launch coincides with the Salesforce World Tour on April 25, where enosix will formally introduce the new brand and its German office. By unlocking the full potential of SAP data and processes, enosix facilitates real-time integration that activates front-end platforms such as Salesforce and Mulesoft.

Who is enosix?

enosix provides real-time access to valuable data and processes across major verticals including manufacturing, energy & utilities, life sciences and retail. With Germany boasting a robust manufacturing and industrial base heavily reliant on SAP systems, the nation is actively pursuing digital transformation initiatives to maintain competitiveness. This entails modernizing legacy systems to meet evolving customer expectations and harnessing data analytics for informed decision making and enhanced digital experiences.

The inauguration of the EMEA Headquarters in Munich on April 25th signifies a significant milestone in enosix’s quest to not only enhance efficiency but also foster transformative human experiences on a global scale. With its expanded presence in EMEA and a steadfast commitment to unlocking 100% accurate SAP process integration, enosix is poised to propel global businesses to unprecedented heights.

German companies transition from one-stop solutions to tailor-made strategies

With a substantial concentration of SAP customers in the German market, enosix’s launch comes at a crucial juncture when global organizations are reevaluating their digital transformation models and transitioning from ECC to S/4HANA.

Empowering European businesses to streamline their processes by unlocking accurate SAP process integration in real time, enosix stands apart from one-stop tools prevalent in the German market. By affording customers choice and flexibility, enosix empowers them to develop successful best-of-breed strategies and tailor solutions to their specific requirements. Given the prevailing macroeconomic landscape, prioritizing solutions that streamline processes, are error-free and drive growth is imperative for German companies.

“In the current market environment, it’s vital for German companies to capitalize on digital transformation and optimize their opportunities for transformative growth. This is where we can disrupt the status quo by offering optimal solutions that create significant impact in the areas of revenue generation, cost/margin optimization, and human capital optimization. Utilizing data and business processes in real-time is more critical than ever before, particularly with the increased integration of AI and the growing importance of a human user experiences,” remarks Gerald Schlechter, Founder and CSO at enosix. “Munich will serve as the epicenter for our EMEA operations, fostering closer engagement with our valued customers and partners across Germany and Europe.”

enosix has witnesses substantial growth over the past year, with nearly half of its EMEA business centered in Germany. By synergizing enosix’s SAP integration expertise with any industry-leading platform, enosix is empowering businesses and expediting their digital transformation journey so they can unlock their full growth potential.

For interview requests with Gerald Schlechter, founder and CSO at enosix, or further information, please contact enosixgermany@zenogroup.com. If you are on site during the Salesforce World Tour event on April 25th, we cordially invite you to meet with Matthias Hussl, Strategic Business Leader, Melanie Abel, Strategic Business Leader, Melanie Strasser, Account Executive, or Matthias Schlechter, Solution Engineer at enosix.

About enosix, Inc.

enosix is an SAP transformation catalyst, empowering businesses by streamlining their digital transformation journey. We provide visionary technology that seamlessly unifies complex SAP with any frontend system (including MuleSoft, Salesforce, and ServiceNow) in real time with flawless execution as a key to endless possibilities of innovation, efficiency, and full growth potential. Feel the Impact™. For more information, visit: www.enosix.com

Contacts

Contact at enosix:
Melanie Strasser: melanie.strasser@enosix.com
Mobile: +49 160 94800597

Agency Contact:
Tobias Rumpp: tobias.rumpp@zenogroup.com

Mobil: +49 (0)162 4673890

BNY Mellon Alcentra Global Credit Income 2024 Target Term Fund, Inc. Declares Monthly Distribution

BNY Mellon Alcentra Global Credit Income 2024 Target Term Fund, Inc. Declares Monthly Distribution


BNY Mellon Alcentra Global Credit Income 2024 Target Term Fund, Inc. Declares Monthly Distribution

NEW YORK–(BUSINESS WIRE)–On April 25, 2024, BNY Mellon Alcentra Global Credit Income 2024 Target Term Fund, Inc. (NYSE: DCF) declared a distribution of $0.035 per share of common stock, payable on May 23, 2024, to shareholders of record at the close of business on May 9, 2024. The ex-dividend date is May 8, 2024. The previous distribution declared in March was $0.035 per share of common stock.


The Fund intends to pay most, but likely not all, of its net income to common shareholders in monthly income dividends. As portfolio and market conditions may change, the distribution rate, the composition of the distribution and the Fund’s policy to declare distributions monthly may be subject to change, including by the Board of Directors.

Important Information

BNY Mellon Investment Adviser, Inc., the investment adviser for the Fund, is part of BNY Mellon Investment Management. BNY Mellon Investment Management is one of the world’s largest asset managers, with $2.0 trillion in assets under management as of March 31, 2024. Through a client-first approach, BNY Mellon Investment Management brings investors specialist expertise through its seven investment firms offering solutions across every major asset class and backed by the breadth and scale of BNY Mellon. Additional information on BNY Mellon Investment Management is available on www.bnymellonim.com. Follow us on LinkedIn for the latest company news and activity.

BNY Mellon Investment Management is a division of BNY Mellon, which has $48.8 trillion in assets under custody and/or administration as of March 31, 2024. Established in 1784, BNY Mellon is America’s oldest bank. Today, BNY Mellon powers capital markets around the world through comprehensive solutions that help clients manage and service their financial assets throughout the investment life cycle. BNY Mellon is the corporate brand of The Bank of New York Mellon Corporation (NYSE: BK). Additional information is available on www.bnymellon.com. Follow us on LinkedIn or visit our newsroom for the latest company news.

Closed-end funds are traded on the secondary market through one of the stock exchanges. The Fund’s investment returns and principal values will fluctuate so that an investor’s shares may be worth more or less than the original cost. Shares of closed-end funds may trade above (a premium) or below (a discount) the net asset value of the fund’s portfolio. There is no assurance that the Fund will achieve its investment objective.

This release is for informational purposes only and should not be considered as investment advice or a recommendation of any particular security.

Contacts

For Press Inquiries:

BNY Mellon Investment Adviser, Inc.

Sue Watt

(212) 815-3757

For Other Inquiries:

BNY Mellon Securities Corporation

The National Marketing Desk

240 Greenwich Street

New York, New York 10286

1-800-334-6899

Citizens Against Government Waste Releases Statement on Adoption of Net Neutrality

Citizens Against Government Waste Releases Statement on Adoption of Net Neutrality


Citizens Against Government Waste Releases Statement on Adoption of Net Neutrality

WASHINGTON–(BUSINESS WIRE)–#GovWaste–Today, Federal Communications Commission (FCC) Chair Jessica Rosenworcel (D) announced the return of net neutrality rules. Following the adoption of several attempts by the FCC to impose strict regulations over the internet, CAGW President Tom Schatz issued the following statement:


“In a fit of destructive, unnecessary, and wasteful regulatory whiplash, the FCC has decided on a 3-2 party line vote to reinstitute net neutrality with Title II common carrier rules. As CAGW has often noted, the repeal of net neutrality led to increased investment and innovation, along with faster speeds and lower costs. There is no factual justification for undoing this progress, which will harm consumers and providers through the same strict and ineffective regulations that were in effect the last time Title II was imposed by the FCC. There is nothing to fix or change regarding regulation of internet service providers. The regulatory uncertainty and increased government control over the internet that will result from the FCC’s decision is further evidence that Congress must step in and resolve these issues permanently by statute. Instead, the taxpayers’ money will be wasted as this regulation moves through the FCC and the courts, where it will likely be overturned.”

CAGW is the nation’s largest nonpartisan, nonprofit organization dedicated to eliminating waste, fraud, abuse, and mismanagement in government.

Contacts

Alexandra Abrams (202) 467-5310
aabrams@cagw.org

New Research from Material and NewtonX Reveals Shifts in Digital Ad Spending and Social Media Strategies

New Research from Material and NewtonX Reveals Shifts in Digital Ad Spending and Social Media Strategies


New Research from Material and NewtonX Reveals Shifts in Digital Ad Spending and Social Media Strategies

New insights show how advertisers and agencies are succeeding and spending in an era of advertising targeting, social media and AI

LOS ANGELES–(BUSINESS WIRE)–A new research report conducted by Material and NewtonX reveals data and insights into the future of advertising, spotlighting trends in targeting, technology, social media and the impact of AI on marketing. The report, The Digital Lead: 2024 Advertising Insights & Tech Trends, provides insights into where brands will be spending in 2024, based on a national survey of agency and advertising professionals.


AI: the future of advertising

With its potential to revolutionize business operations and optimize campaigns, no topic commands more interest among modern advertising professionals than AI. 59% of respondents (unaided) cite AI as the top subject on their minds, and it is viewed more favorably than not, emphasizing its potential to transform industry practices in the short and long term. However, concerns persist, with many unknowns about how AI will be applied, which social media platforms are using it most effectively and whether it will result in more accurate targeting or reduced costs.

More spending in 2024

After several lean post-pandemic years, most advertising and agency executives report budget increases for 2024. Digital advertising is expected to constitute around two thirds of total ad spend among advertisers. Social media is the most desired allocation of spend for brand-focused advertising, with search engine marketing and social media tied with the lead for performance advertising.

Cookie deprecation only draws moderate concern

With the end of third-party cookies looming, advertisers believe they are more prepared than previously anticipated. Many are already shifting to embrace first-party customer data strategies; other emerging approaches include contextual and cohort-based targeting, machine-learning systems and CPC/CPA models.

Key findings

  • 45% of professionals anticipate a change to their media mix because of third-party cookie deprecation.
  • 56% of agencies and advertisers expect their budgets to increase in the next year.
  • 59% of participants see AI as the greatest influence in the future of advertising.
  • 48% of respondents say strengthening their national advertising is the top priority for 2024, followed by 26% whose top focus is on improving local advertising.

It has never been more important for advertising professionals to be dialed in to the shifts and innovations happening across the business landscape, to enable future-forward strategies,” said Jeremy Sack, president, Material. “Our goal with this report is to provide some key answers and provoke more questions and learning.”

It’s no surprise AI has emerged as the key theme on advertisers’ minds in this study,” said Jackie Cutrone, CMO of NewtonX. “We’ve harnessed the power of AI to gather and analyze this data, and along with our partners at Material, we’re committed to leveraging AI technology to provide business insights that help advertisers and brands navigate the challenges of 2024 and beyond.”

Read the full report

To read the complete “The Digital Lead: 2024 Advertising Insights & Tech Trends” study, please visit our website where you can learn more about the findings and download your copy of the report.

Survey methodology

Survey participants in the national study consisted of 250 advertising professionals who have influence in advertising/marketing strategy and/or execution. 125 participants were agency professionals and 125 were in-house advertising professionals. Respondents were also broken out by gender, size of company/agency, industry and management vs. individual performers. Additional details on survey respondents are available in the full report.

About NewtonX

The world’s leading businesses find their advantage with NewtonX.

We’re the only B2B research company that solves the challenges of today’s insights leaders by connecting them with verified business expertise. Our AI-driven algorithm—the NewtonX Graph—custom recruits the perfect audience for your business question from an open network of 1.1 billion professionals across 140 industries. Every professional is 100% verified, so you can make your next bold move with confidence.

Together with our clients, we’re ushering in a new standard of truth in B2B insights. To learn more, head to www.newtonx.com.

About Material

Material is a global strategy partner that combines deep human insights with modern technology – a proprietary Science + Systems approach that speeds engagement and growth for the world’s most recognizable brands and innovative companies. We design + build customer-centric business models and experiences to create transformative relationships between businesses and the people they serve. Learn more at www.materialplus.io.

Contacts

Patrick Reiher, Material

patrick.reiher@materialplus.io
860 930 9862

First BanCorp. Declares Quarterly Cash Dividend on Common Stock

First BanCorp. Declares Quarterly Cash Dividend on Common Stock


First BanCorp. Declares Quarterly Cash Dividend on Common Stock

SAN JUAN, Puerto Rico–(BUSINESS WIRE)–First BanCorp. (the “Corporation”) (NYSE: FBP), the bank holding company for FirstBank Puerto Rico, announced today that its Board of Directors has declared a quarterly cash dividend of $0.16 per share on its outstanding common stock. The dividend is payable on June 14, 2024 to shareholders of record at the close of business on May 30, 2024.


About First BanCorp.

First BanCorp. is the parent corporation of FirstBank Puerto Rico, a state-chartered commercial bank with operations in Puerto Rico, the U.S. and British Virgin Islands and Florida, and of FirstBank Insurance Agency, LLC. Among the subsidiaries of FirstBank Puerto Rico is First Federal Finance Limited Liability Company, a small loans company. First BanCorp’s shares of common stock trade on the New York Stock Exchange under the symbol “FBP.”

Safe Harbor

This press release may contain “forward-looking statements” concerning the Corporation. The words or phrases “expect,” “anticipate,” “intend,” “look forward,” “should,” “would,” “believes” and similar expressions are meant to identify “forward-looking statements” within the meaning of Section 27A of the Securities Act of 1933, as amended, and Section 21E of the Securities Exchange Act of 1934, as amended, and are subject to the safe harbor created by such sections. Such forward-looking statements include, but are not limited to, statements regarding the Corporation’s ability to pay dividends on the Corporation’s Common Stock in any future periods. Forward-looking statements involve known and unknown risks, uncertainties and contingencies that may cause actual results to differ materially from the expectations expressed or implied by such forward-looking statements. These risks, uncertainties and contingencies include, but are not limited to the factors described in the Corporation’s most recent Annual Report on Form 10-K, in its Quarterly Reports on Form 10-Q and in our other filings with the Securities and Exchange Commission. The Corporation undertakes no obligation to update any “forward-looking statements” to reflect occurrences or unanticipated events or circumstances after the date of such statements, except as required by securities laws.

Contacts

First BanCorp.
Ramon Rodríguez

Senior Vice President

Corporate Strategy and Investor Relations

(787) 729-8200 Ext. 82179

ramon.rodriguez@firstbankpr.com