Keysight Secures New Test Case Validations for Narrowband Non-Terrestrial Networks Standard

Keysight Secures New Test Case Validations for Narrowband Non-Terrestrial Networks Standard


Keysight Secures New Test Case Validations for Narrowband Non-Terrestrial Networks Standard

  • Test case validations include transmitter and receiver, demodulation, and radio resource management for narrowband internet of things over non-terrestrial networks
  • Validations support certification testing at GCF Recognized Test Organizations
  • Record number of new test cases secured at Conformance Agreement Group #78 meeting, including RedCap radio resource management for single receiver and inter-radio access technology with EUTRA

SANTA ROSA, Calif.–(BUSINESS WIRE)–$KEYS #3GPPKeysight Technologies, Inc. (NYSE: KEYS) has validated new conformance test cases for 3rd Generation Partnership Project (3GPP) Release 17 (Rel-17) standards for non-terrestrial networks (NTN) using narrowband internet of things (NB-IoT) technology. Available through the Keysight RF/RRM DVT and Conformance Toolset, the validated test cases were obtained at the Conformance Agreement Group (CAG) #78 meeting of the Global Certification Forum (GCF).


The convergence of terrestrial and non-terrestrial networks is a key component of the telecommunications industry’s goal of achieving global coverage, enabling new use cases and ubiquitous mobile connectivity. NB-IoT over NTN extends service to use cases requiring non-continuous data connections with low power consumption, while maintaining sufficient throughput, for diverse applications such as supply chain tracking and two-way messaging.

The new NB-IoT NTN conformance test case validations cover transmitter and receiver, demodulation, and radio resource management (RRM). The RF/RRM DVT and Conformance Toolset ensures mobile devices perform as expected on a live mobile network and is an approved test platform for device certification at GCF and PTCRB supporting a variety of frequency bands.

These test case validations also enable Keysight to support certification testing at GCF Recognized Test Organizations (RTO). The test cases are managed through the Keysight ATLAS Test Management Center, the company’s new framework for automated acceptance testing.

Keysight is at the forefront of NTN conformance solutions with the S8711A Test Application Toolset and UXM 5G, featuring a built-in channel emulator that emulates satellite orbits to test and certify devices in real-world conditions. The company has validated test cases for Skylo’s Rel-17 NB NTN certification program and recently demonstrated satellite handovers in Low Earth Orbit constellations, using UXM 5G and PROPSIM at Mobile World Congress.

In addition, Keysight expanded its portfolio of validated test cases to other crucial 3GPP Release 16 (Rel-16) and Rel-17 areas to achieve a record number of new validations in a single meeting. Notable test case validations included RRM RedCap for single receiver and inter-radio access technology with EUTRA.

Muthu Kumaran, General Manager for Keysight’s Device Acceptance Solutions, said: “Industry standards and reference certification programs play a pivotal role in expanding technology adoption. Keysight‘s NTN solutions, which enables NB-IoT NTN certification testing in GCF Recognized Test Organizations, are empowering the industry to advance mixed terrestrial and non-terrestrial connection scenarios with confidence by adhering to globally recognized standards. We look forward to continuing our support for the wireless industry in the realm of NTN through our comprehensive test solutions.”

Resources

About Keysight Technologies

At Keysight (NYSE: KEYS), we inspire and empower innovators to bring world-changing technologies to life. As an S&P 500 company, we’re delivering market-leading design, emulation, and test solutions to help engineers develop and deploy faster, with less risk, throughout the entire product lifecycle. We’re a global innovation partner enabling customers in communications, industrial automation, aerospace and defense, automotive, semiconductor, and general electronics markets to accelerate innovation to connect and secure the world. Learn more at Keysight Newsroom and www.keysight.com.

Contacts

Keysight Media Contacts

Paul Erwin

Americas

+1 248 430 9075

paul.erwin@keysight.com

Fusako Dohi

Asia

+81 42 660-2162

fusako_dohi@keysight.com

Jenny Gallacher

Europe

+44 (0) 7800 737 982

jenny.gallacher@keysight.com

U.S. Congressional Delegation Tours Belden Facility in Nogales, Mexico

U.S. Congressional Delegation Tours Belden Facility in Nogales, Mexico


U.S. Congressional Delegation Tours Belden Facility in Nogales, Mexico

Tour highlighted fiber optic systems production capabilities to members of Congress and representatives from U.S. Consulate in Mexico


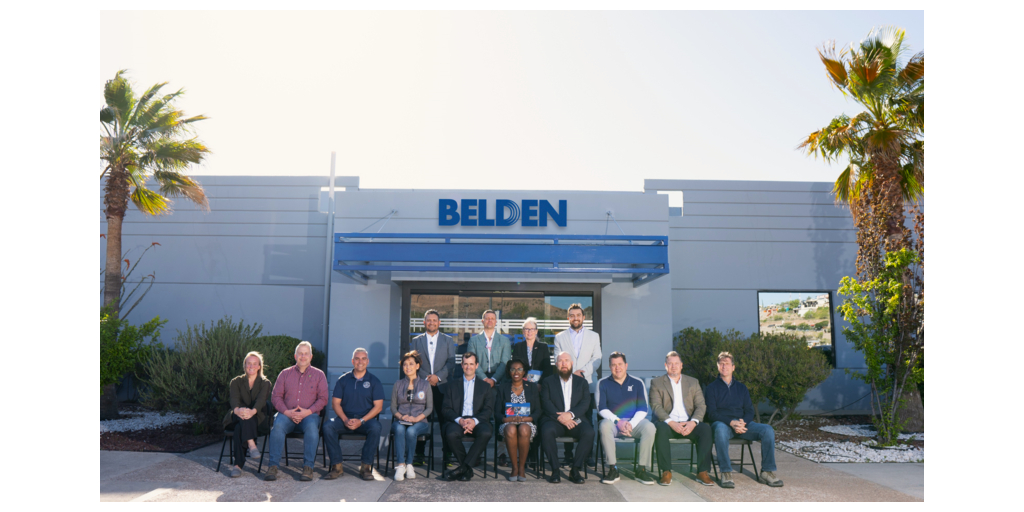
NOGALES, SONORA, Mexico–(BUSINESS WIRE)–Belden Inc. (NYSE: BDC), a leading global supplier of network infrastructure and digitization solutions, last week welcomed a group of U.S. congressional representatives, members of the U.S. Consulate and representatives from the Bipartisan Policy Center to its manufacturing facility in Nogales, Mexico. Belden leaders hosted the delegation for a tour Friday, April 26, highlighting the productivity of the Nogales facility and its role in enabling the solutions Belden delivers across North America and worldwide.

The tour showcased the significant investments Belden has made in the last two years to increase fiber optic production capabilities. The Nogales plant – which has a production capacity of 7.4 million feet of cable per day – manufactures fiber products that are deployed in such environments as data centers, broadcast applications and industrial facilities. With the rise of technologies like AI, robotics and 5G, these markets are experiencing ever-increasing demands for bandwidth, data rates and speed that are best served by fiber optic systems.

The members of Congress in attendance were a bipartisan group seeking to learn more about economic activity in the region in order to advance sound public policy. Participants included representatives from Arizona, California, Illinois and New York. The visit to Belden underscored the importance of the binational relationship between Mexico and the United States in facilitating productivity and economic activity.

Belden’s Nogales location helps bolster the resilience of the company’s supply chain, ensuring efficient and secure support for the U.S. infrastructure industry. The proximity to the U.S. also enables quicker delivery times and access to raw materials sourced within the region, such as copper mined in Arizona. The location also benefits from a pipeline of qualified talent from local universities and tech centers.

“We are honored to welcome these visitors to our state-of-the-art production facility,” said Jay Wirts, Belden’s Executive Vice President of Enterprise Solutions. “Having a dialogue with these leaders gives us the opportunity to showcase how the solutions we develop at this location – and others like it across the globe – are powering the network and digitization needs of our customers.”

Belden’s Syracuse, NY location has also attracted the attention of policymakers thanks to recent innovation, capital investments and job creation in the broadband space. In February, New York Governor Kathy Hochul visited Belden to announce a multimillion-dollar award to support Syracuse-based growth initiatives, and in 2023, Belden leaders joined Senate Majority Leader Chuck Schumer, Senior White House advisor Mitch Landrieu, and Assistant Secretary Alan Davidson from the National Telecommunications and Information Administration (NTIA) as they recognized Belden’s investment in broadband innovation at its Syracuse, NY, facility.

About Belden

Belden Inc. delivers the infrastructure that makes the digital journey simpler, smarter and secure. We’re moving beyond connectivity, from what we make to what we make possible through a performance-driven portfolio, forward-thinking expertise and purpose-built solutions. With a legacy of quality and reliability spanning 120-plus years, we have a strong foundation to continue building the future. We are headquartered in St. Louis and have manufacturing capabilities in North America, Europe, Asia, and Africa. For more information, visit us at www.belden.com; or follow us on Facebook, LinkedIn and X/Twitter.

Belden and the Belden logo are trademarks or registered trademarks of Belden Inc. or its affiliated companies in the United States and other jurisdictions. Belden and other parties may also have trademark rights in other terms used herein.

Contacts

Kimberly Spiegel
Sr. Director, Americas & EMEA Marketing

M: +1 317.316.6543

kimberly.spiegel@belden.com

FNB Harvest annonce a distribution en espèces finale d’avril 2024 pour le FNB Harvest de bons du Trésor du Canada

FNB Harvest annonce a distribution en espèces finale d’avril 2024 pour le FNB Harvest de bons du Trésor du Canada


FNB Harvest annonce a distribution en espèces finale d’avril 2024 pour le FNB Harvest de bons du Trésor du Canada

OAKVILLE, Ontario–(BUSINESS WIRE)–Groupe de portefeuilles Harvest Inc. (« Harvest ») annonce la distribution en espèces finale de avril 2024 pour la distribution suivante pour le FNB Harvest de bons du Trésor du Canada pour le mois se terminant le 30 avril 2024. La distribution sera versée vers le 9 mai 2024 aux porteurs de parts inscrits le 30 avril 2024.


Les détails concernant le montant final de la distribution en espèces par part sont les suivants :

FNB Harvest

Symbole TSX

Distribution estimée

FNB Harvest de bons du Trésor du Canada

TBIL

0,2171$ par unité

Pour plus de renseignements, veuillez visiter le site www.harvestportfolios.com, écrire à info@harvestetfs.com ou composer sans frais le 1 866 998-8298.

À propos de Groupe de portefeuilles Harvest Inc.

Fondé en 2009, Harvest est un gestionnaire canadien indépendant de fonds de placement qui gère 4,1 milliards de dollars d’actifs pour le compte d’investisseurs canadiens. Chez Harvest ETFs, nous pensons que les investisseurs peuvent créer et préserver leur richesse en détenant à long terme des entreprises de haute qualité. Cette philosophie fondamentale est au cœur de l’approche d’investissement de notre gamme de FNB.

Les offres de base de FNB Harvest sont centrées sur des stratégies d’options d’achat couvertes, disponibles sous trois formes: revenu d’actions, revenu d’actions amélioré et revenu fixe. Dans nos portefeuilles de revenu d’actions, nous suivons un processus en trois étapes : identifier les secteurs de croissance prometteurs; sélectionner des entreprises bien positionnées dans ces secteurs; et optimiser les rendements en générant des revenus grâce aux options d’achats couvertes. Pour améliorer les rendements potentiels, nous proposons une exposition à effet de levier à certains FNB Harvest grâce à notre gamme améliorée. Nos ETF à revenu fixe se concentrent sur l’investissement dans les ETF du Trésor américain tout en employant une stratégie d’options d’achat couvertes. Cette approche nous permet de proposer des distributions mensuelles élevées à nos investisseurs. Pour ceux qui recherchent des FNB sans options d’achat, nous proposons également nos FNB axés sur la croissance en actions, spécialement conçus pour saisir les opportunités dans les secteurs de croissance et les principales tendances.

_______________________________

Pour plus de renseignements : 

Site Web : https://www.harvestportfolios.com 

Courriel : info@harvestetfs.com
Sans frais : 1 866 998-8298 

________________________________

Abonnez-vous à notre bulletin mensuel : 

https://harvestportfolios.com/subscribe 

________________________________

Suivez-nous sur les réseaux sociaux : 

LinkedIn : https://www.linkedin.com/company/harvest-portfolios-group 

Twitter : https://twitter.com/harvestetfs 

Facebook : https://www.facebook.com/HarvestETFs 

YouTube : https://www.youtube.com/c/HarvestETFs 

Spotify : https://open.spotify.com/show/4Nh71jcf778tZDICT7TznK 

________________________________

Vous paierez habituellement des frais de courtage à votre courtier si vous achetez ou vendez des parts du fonds d’investissement à la Bourse de Toronto (TSX). Si les parts du fonds d’investissement sont achetées ou vendues à la TSX, l’investisseur pourra payer un montant supérieur à la valeur liquidative actuelle à l’achat et recevoir un montant inférieur à la vente. La propriété de parts d’un fonds d’investissement donne lieu à des frais permanents. Les fonds d’investissement ne sont pas garantis, leur valeur fluctue souvent et leur rendement passé n’est pas indicatif de leur rendement dans l’avenir. Les distributions vous sont versées en espèces, à moins que vous ne demandiez, aux termes de votre participation à un régime de réinvestissement des distributions, qu’elles soient réinvesties dans des parts de catégorie A, de catégorie B ou de catégorie U du Fonds. Si le Fonds gagne moins que les montants distribués, la différence constitue un remboursement de capital. Le fonds d’investissement doit établir des documents renfermant des renseignements essentiels sur le fonds, où l’on peut trouver de l’information plus détaillée sur le fonds.

Contacts

Pour plus de renseignements :
Site Web : https://www.harvestportfolios.com
Courriel : info@harvestetfs.com
Sans frais : 1 866 998-8298

La gestion mondiale d’actifs CI nomme le gestionnaire de portefeuille pour deux Fonds de sociétés de petites capitalisations d’actions américaines

La gestion mondiale d’actifs CI nomme le gestionnaire de portefeuille pour deux Fonds de sociétés de petites capitalisations d’actions américaines


La gestion mondiale d’actifs CI nomme le gestionnaire de portefeuille pour deux Fonds de sociétés de petites capitalisations d’actions américaines

TORONTO–(BUSINESS WIRE)–Gestion mondiale d’actifs CI (« GMA CI ») a annoncé aujourd’hui la nomination de CI Segall Bryant & Hamill Asset Management (« SBH ») à titre de sous-conseiller du Fonds de sociétés de petites capitalisations d’actions américaines et de la Catégorie de société d’actions américaines à petite capitalisation, à compter d’aujourd’hui.


Le Fonds de sociétés de petites capitalisations d’actions américaines et la Catégorie de société d’actions américaines à petite capitalisation (les « Fonds ») font partie de la gamme de Fonds privés Assante, qui est gérée par GMA CI et offerte aux clients de Gestion de patrimoine Assante CI.

SBH est une société d’investissement basée à Chicago qui a été fondée en 1994 et qui gère et administre 25,4 milliards de dollars américains1 (au 31 mars 2024) au nom d’investisseurs institutionnels et privés. La société gère un large éventail de stratégies d’actions américaines et internationales à revenu fixe en utilisant une approche d’équipe axée sur la recherche exclusive de haute qualité.

Pour gérer les Fonds, GMA CI a choisi l’équipe quantitative de SBH, qui gère des portefeuilles d’actions à petite capitalisation depuis 2008. L’approche d’investissement quantitative de l’équipe cible les actions « bien équilibrées » qui mènent dans de multiples dimensions, y compris les caractéristiques de valeur, les facteurs positifs de l’élan de la société, la force de l’entreprise et la rentabilité. La gestion des risques est intégrée à l’approche SBH et est conçue pour soutenir la « prise de risque intelligente ».

« SBH offre une approche unique et différenciée pour investir dans des actions américaines à petite capitalisation, permettant aux investisseurs de tirer parti d’une gamme diversifiée d’occasions dans l’ensemble du secteur », a déclaré Marc-André Lewis, chef des investissements et co-chef de GMA CI. « Sa stratégie a également produit des résultats en matière de rendement et de gestion des risques, générant constamment de solides rendements relatifs corrigés du risque. Nous sommes convaincus que SBH ajoutera de la valeur aux clients et renforcera les solutions gérées qui utilisent les Fonds dans le cadre de leurs portefeuilles. »

L’équipe quantitative de SBH est dirigée par Scott Decatur, Ph. D., qui possède 26 ans d’expérience en investissement et qui se concentre sur le développement et la gestion de stratégies quantitatives d’investissement en actions. SBH est signataire des Principes pour les investissements responsables des Nations Unies et intègre les facteurs environnementaux, sociaux et de gouvernance dans son processus d’investissement.

SBH est une filiale en propriété exclusive de Corient Holdings Inc., une filiale américaine de CI Financial Corp. SBH remplace Epoch Investment Partners, Inc. à titre de sous-conseiller des Fonds. Le Comité d’examen indépendant des Fonds a examiné les changements concernant les questions de conflits d’intérêts potentiels et a fourni sa recommandation positive, ayant déterminé que les changements atteignent un résultat juste et raisonnable pour chaque fonds.

À propos de Gestion mondiale d’actifs CI

Gestion mondiale d’actifs CI est l’une des plus grandes sociétés de gestion d’investissement du Canada. Elle offre une vaste gamme de produits et de services de placement dont tous les détails se trouvent sur son site Web : www.ci.com. Gestion mondiale d’actifs CI est une filiale de Financière CI (TSX : CIX), une société mondiale intégrée de gestion d’actifs et de patrimoine avec environ 474.2 milliards de dollars d’actifs au 31 mars 2024.

  1. ASA/ASG en date du 31/03/2024 est de 25,41 milliards de dollars américains. Les actifs de Corient Private Wealth de 7,03 milliards de dollars sont inclus dans la partie des actifs sous gestion et les actifs de modèle UMA d’environ 558,5 millions de dollars sont inclus dans la partie ASA du total des ASG/ASA.

Cette communication est destinée à des fins d’information uniquement et ne constitue pas une offre de vente ou la sollicitation d’une offre d’achat de fonds communs de placement gérés par Gestion mondiale d’actifs CI et n’est pas, et ne doit pas être interprétée comme, un conseil en matière d’investissement, de fiscalité, de droit ou de comptabilité, et ne doit pas être invoquée à cet égard. Tous les efforts ont été déployés pour s’assurer que l’information contenue dans ce document était exacte au moment de sa publication. Nous recommandons aux particuliers de demander l’avis de professionnels compétents au sujet d’un placement précis. Les investisseurs devraient consulter leur conseiller professionnel avant d’apporter tout changement à leurs stratégies d’investissement. Ces placements peuvent ne pas convenir aux circonstances d’un investisseur.

Les investissements dans un fonds commun de placement peuvent comporter des commissions, des commissions de suivi, des frais de gestion et d’autres frais. Veuillez lire le prospectus avant d’investir. Les fonds communs de placement ne sont pas garantis, leur valeur fluctue fréquemment, et les rendements passés pourraient ne pas se répéter.

Gestion mondiale d’actifs CI est le nom d’une entreprise enregistrée de CI Investments Inc. © CI Investments Inc. 2024. Tous droits réservés.

Contacts

Murray Oxby

Vice-président, Communications d’entreprise

Gestion mondiale d’actifs CI

416 681-3254

moxby@ci.com

La sexta edición de los premios WIBA 2024 distingue a las personalidades más influyentes de las redes sociales en una ceremonia celebrada durante el Festival de Cannes

La sexta edición de los premios WIBA 2024 distingue a las personalidades más influyentes de las redes sociales en una ceremonia celebrada durante el Festival de Cannes


La sexta edición de los premios WIBA 2024 distingue a las personalidades más influyentes de las redes sociales en una ceremonia celebrada durante el Festival de Cannes

Entre los galardonados en ediciones anteriores de los WIBA figuran Maye Musk, Khaby Lame, Coco Rocha, Richard Orlinski, Nikkie Tutorials, Foodgod y otros creadores de tendencias internacionales

CANNES, Francia–(BUSINESS WIRE)–La sexta edición de los premios WIBA para personalidades de las redes sociales con la misión de cambiar el mundo tendrá lugar el 24 de mayo de 2024, en el emblemático Hotel Martinez durante el Festival de Cine de Cannes. El evento reúne a cientos de los principales creadores de contenidos del mundo, responsables de los momentos más virales del año. La velada incluye un cóctel de recepción, una cena de gala y la ceremonia de entrega de premios con la actuación especial de Sonique.


La World Influencers Association (WIBA), con sede en Mónaco, supervisa los premios WIBA. Es el primer y único premio internacional que reconoce el trabajo de personalidades de las redes sociales en múltiples categorías, desde mejor influencer de belleza a mejor influencer de mascotas.

En 2023, la revista Forbes describió el evento con palabras inspiradoras. “Los premios anuales World Influencers reúnen a los protagonistas de los momentos virales y a los pioneros de la longevidad digital en el evento de networking más importante de la Costa Azul”. Dada la celebridad de tanto talento virtual raramente presente en el mismo espacio físico, la ceremonia de los WIBA es una oportunidad interesante para conocer el ritmo de las redes sociales en el mundo.

Los galardonados de los premios WIBA entretienen y sensibilizan a un público masivo a una escala sin precedentes. Entre los ganadores anteriores figuran Maye Musk, Khaby Lame, Richard Orlinski, Nusret Gökçe, Ellen Von Unwerth, Gianluca Vacchi, Kat Graham, Kelly Rutherford y Coco Rocha, entre otras estrellas de Internet. El seguimiento en directo típico de una gala de los premios WIBA supera los 200 millones de visitas.

Mariia Grazhina Chaplin, directora general de WIBA: «Me complace anunciar la sexta edición de los premios WIBA. Al coincidir este evento distintivo con el Festival de Cine de Cannes, los galardonados, personas influyentes, no sólo entretienen a su público con imágenes memorables, sino que también les informan sobre las últimas novedades del cine desde la plataforma más importante de la industria. A la vez que rendimos homenaje a la crème de la crème de la actualidad, estamos preparando a los líderes de opinión y a los creadores de tendencias del mañana. Más adelante, en 2024, tenemos previsto llevar los eventos de la WIBA a Estados Unidos y Oriente Medio para impulsar nuestra misión divulgativa. Queremos canalizar el potencial de los influencers para convertirlo en un poder internacional que actúe para mejorar, luchando por la paz universal y la igualdad de oportunidades para todos».

www.wiba.global

El comunicado en el idioma original es la versión oficial y autorizada del mismo. Esta traducción es solamente un medio de ayuda y deberá ser comparada con el texto en idioma original, que es la única versión del texto que tendrá validez legal.

Contacts

info@wiba.global

Australia International Remittance Business Report 2024: Analysis by Transaction Value & Volume, Inbound and Outbound Transfers to and from Key States, Consumer Demographics 2019-2028 – ResearchAndMarkets.com

Australia International Remittance Business Report 2024: Analysis by Transaction Value & Volume, Inbound and Outbound Transfers to and from Key States, Consumer Demographics 2019-2028 – ResearchAndMarkets.com


Australia International Remittance Business Report 2024: Analysis by Transaction Value & Volume, Inbound and Outbound Transfers to and from Key States, Consumer Demographics 2019-2028 – ResearchAndMarkets.com

DUBLIN–(BUSINESS WIRE)–The “Australia International Remittance Market Business and Investment Opportunities – Analysis by Transaction Value & Volume, Inbound and Outbound Transfers to and from Key States, Consumer Demographics – Q1 2024” report has been added to ResearchAndMarkets.com’s offering.


International inbound remittance market in Australia has increased at 16.9% during 2023 to reach US$ 1.73 billion in 2024. Over the forecast period (2024-2028), market size is expected to record a CAGR of 10.6%, increasing from US$ 1.48 billion in 2023 to reach US$ 2.60 billion by 2028.

Remittance outflow market in Australia has increased at 28.5% during 2023 to reach US$ 10.11 billion in 2024. Over the forecast period (2024-2028), market size is expected to record a CAGR of 16.2%, increasing from US$ 7.87 billion in 2023 to reach US$ 18.46 billion by 2028.

This report provides a comprehensive analysis of the international inbound and outbound remittance market in Australia. It covers the market opportunity by transaction value, transaction volume, average value per transaction, key market players, market opportunity by channel, consumer profile, and by sending / receiving countries.

The research methodology is based on industry best practices. Its unbiased analysis leverages a proprietary analytics platform to offer a detailed view on emerging business and investment market opportunities.

Reasons to buy

  • Comprehensive and Up-to-Date Information: The report provides comprehensive and up-to-date information on the Australia international inbound and outbound remittance market, including market size, growth trends, transaction value, transaction volume, average value per transaction, and market share analysis by transfer channel, consumer demographics, and key countries.
  • Understand Competitive Landscape: Get a high-level view of competitive landscape through market share data on key players in the market.
  • Actionable Insights for Businesses and Investors: The report provides data centric analysis for businesses and investors operating in the Australia remittance market. It helps them identify new opportunities, assess risks, and make informed business decisions.
  • Forecasts for Future Market Growth: The report provides forecasts for future market growth, enabling businesses and investors to plan and strategize effectively.

Key Attributes:

Report Attribute Details
No. of Pages 130
Forecast Period 2024 – 2028
Estimated Market Value (USD) in 2024 $1.7 Billion
Forecasted Market Value (USD) by 2028 $2.6 Billion
Compound Annual Growth Rate 10.6%
Regions Covered Australia

Scope

International Inbound Market Opportunity Trend Analysis in Australia

  • By Transaction Value
  • By Transaction Volume
  • By Average Value Per Transaction

International Inbound Market Opportunity Trend Analysis by Channel in Australia

  • Digital (transaction value, transaction volume, average value per transaction)
  • Mobile (transaction value, transaction volume, average value per transaction)
  • Non-Digital (transaction value, transaction volume, average value per transaction)

International Inbound Remittance Analysis of Consumer Profile in Australia

  • Analysis by age group of senders
  • Analysis by income of senders
  • Analysis by occupation of senders
  • Analysis by occupation of beneficiaries
  • Analysis by purpose

International Inbound Remittance Flow Analysis (Country to State / Region) in Australia

  • Market opportunity by key sending countries (transaction value, transaction volume, average value per transaction)
  • Market share by transfer channel by key state / regions

International Outbound Market Opportunity Trend Analysis in Australia

  • By Transaction Value
  • By Transaction Volume
  • By Average Value Per Transaction

International Outbound Market Opportunity Trend Analysis by Channel in Australia

  • Digital (transaction value, transaction volume, average value per transaction)
  • Mobile (transaction value, transaction volume, average value per transaction)
  • Non-Digital (transaction value, transaction volume, average value per transaction)

International Outbound Remittance Analysis of Consumer Profile in Australia

  • Analysis by age group of senders
  • Analysis by income of sender
  • Analysis by occupation of sender
  • Analysis by occupation of beneficiaries
  • Analysis by purpose

International Outbound Remittance Flow Analysis (State / Region to Country) in Australia

  • Market opportunity by key sending countries (transaction value, transaction volume, average value per transaction)
  • Market share by transfer channel by key state / regions

For more information about this report visit https://www.researchandmarkets.com/r/fvxumd

About ResearchAndMarkets.com

ResearchAndMarkets.com is the world’s leading source for international market research reports and market data. We provide you with the latest data on international and regional markets, key industries, the top companies, new products and the latest trends.

Contacts

ResearchAndMarkets.com

Laura Wood, Senior Press Manager

press@researchandmarkets.com
For E.S.T Office Hours Call 1-917-300-0470

For U.S./ CAN Toll Free Call 1-800-526-8630

For GMT Office Hours Call +353-1-416-8900

Hope Bancorp Declares Quarterly Cash Dividend of $0.14 Per Share

Hope Bancorp Declares Quarterly Cash Dividend of $0.14 Per Share


Hope Bancorp Declares Quarterly Cash Dividend of $0.14 Per Share

LOS ANGELES–(BUSINESS WIRE)–Hope Bancorp, Inc. (the “Company”) (NASDAQ: HOPE) today announced that its Board of Directors declared a quarterly cash dividend of $0.14 per common share. The dividend is payable on or about May 23, 2024, to all stockholders of record as of the close of business on May 9, 2024.

About Hope Bancorp, Inc.

Hope Bancorp, Inc. (NASDAQ: HOPE) is the holding company of Bank of Hope, the first and only super regional Korean American bank in the United States with $18.09 billion in total assets as of March 31, 2024. Headquartered in Los Angeles and serving a multi-ethnic population of customers across the nation, the Bank provides a full suite of commercial, corporate and consumer loans, including commercial and commercial real estate lending, SBA lending, residential mortgage and other consumer lending; deposit and fee-based products and services; international trade financing; cash management services, foreign currency exchange solutions, and interest rate derivative products, among others. Bank of Hope operates 48 full-service branches in California, Washington, Texas, Illinois, New York, New Jersey, Virginia, Alabama, and Georgia. The Bank also operates SBA loan production offices, commercial loan production offices, and residential mortgage loan production offices in the United States; and a representative office in Seoul, Korea. Bank of Hope is a California-chartered bank, and its deposits are insured by the FDIC to the extent provided by law. Bank of Hope is an Equal Opportunity Lender. For additional information, please go to www.bankofhope.com. By including the foregoing website address link, the Company does not intend to and shall not be deemed to incorporate by reference any material contained or accessible therein.

Contacts

Julianna Balicka

EVP & Chief Financial Officer

213-235-3235

julianna.balicka@bankofhope.com

Angie Yang

SVP, Director of Investor Relations & Corporate Communications

213-251-2219

angie.yang@bankofhope.com

Hope Bancorp and Territorial Bancorp Announce Definitive Merger Agreement

Hope Bancorp and Territorial Bancorp Announce Definitive Merger Agreement


Hope Bancorp and Territorial Bancorp Announce Definitive Merger Agreement

LOS ANGELES & HONOLULU–(BUSINESS WIRE)–Hope Bancorp, Inc. (“Hope Bancorp”) (NASDAQ: HOPE), the holding company of Bank of Hope, and Territorial Bancorp Inc. (“Territorial”) (NASDAQ: TBNK), the stock holding company of Territorial Savings Bank, today jointly announced the signing of a definitive merger agreement, which is expected to create the largest regional bank catering to multi-ethnic customers across the continental United States and the Hawaiian Islands.

As of December 31, 2023, Territorial had total assets of $2.24 billion, total loans of $1.31 billion and total deposits of $1.64 billion. Territorial Savings Bank, a state-chartered savings bank, originally chartered in 1921 by the Territory of Hawai‘i, conducts business from its headquarters in Honolulu, Hawai‘i, and operates 28 branches in the state. Hope Bancorp intends to preserve the 100-plus year legacy of the Territorial Savings Bank brand name, culture and commitment to local communities. Following the completion of the transaction, the legacy Territorial franchise in Hawai‘i will continue to do business under the Territorial Savings Bank brand, as a trade name of Bank of Hope.

Strategic Highlights of Proposed Transaction

  • Adds stable, low-cost core deposit base to the combined company
  • Accelerates diversification of the combined company’s loan mix through the addition of a residential mortgage portfolio with excellent asset quality
  • Opportunity to grow Territorial’s market share and enhance the customer experience by leveraging the combined company’s larger balance sheet, resources and more extensive array of banking products and services
  • Combined footprint expands to include attractive Hawai‘i market with large Asian American and Pacific Islander communities
  • Strong levels of capital to support the growth of the combined franchise

“We believe this combination will strengthen our position as one of the leading Asian American banks in the country by expanding our footprint to the Hawaiian Islands,” stated Kevin S. Kim, Chairman, President and Chief Executive Officer of Hope Bancorp, Inc. “Upon the close of the transaction, we believe Territorial’s high-quality deposit base will enhance our core funding mix and Territorial’s residential mortgage portfolio will accelerate the diversification of our loans. We look forward to building on Territorial’s 100-plus year legacy of exemplary customer service and support of local communities in a strategically important market.”

“Our merger with Hope Bancorp will bring together two companies that share long-standing commitments to our customers and the communities where we live and work,” said Allan S. Kitagawa, Chairman, President and Chief Executive Officer of Territorial Bancorp Inc. “Our name will remain Territorial Savings Bank, and we expect a seamless transition for our customers, who will continue to benefit from our strong focus on relationship banking, personalized service and tailored financial solutions. At the same time, we believe the proposed combination will strengthen Territorial Savings Bank for the long term, providing many advantages for our customers and employees as we become part of a larger organization with greater resources, enhanced technology platforms, and an expanded array of banking products and services.”

Under the terms of the merger agreement, upon completion of the transaction, Territorial shareholders will receive a fixed exchange ratio of 0.8048 shares of Hope Bancorp common stock in exchange for each share of Territorial common stock they own, in a 100% stock-for-stock transaction valued at approximately $78.6 million. Based on the closing price of Hope Bancorp’s common stock on April 26, 2024, this represents a value of $8.82 per share of Territorial common stock, although the actual value will be determined upon transaction closing. Upon completion of the transaction, it is expected that Hope Bancorp shareholders will own approximately 94.4% of the combined entity and Territorial shareholders will own approximately 5.6%, with the actual percentages being determined as of the transaction closing date. The transaction is intended to qualify as a tax-free reorganization for Territorial shareholders. The proposed transaction, after the close, is expected to be immediately accretive to Hope Bancorp’s earnings.

The Boards of Directors of both companies have approved the merger agreement and the transaction contemplated thereby. The transaction is expected to close by year-end 2024, subject to regulatory approvals, the approval of Territorial shareholders, and the satisfaction of other customary closing conditions.

Hope Bancorp is being advised by the investment banking firm of D.A. Davidson & Co., and the law firm of Greenberg Traurig, LLP. Territorial is being advised by the investment banking firm of Keefe, Bruyette & Woods, a Stifel Company, and the law firm of Luse Gorman, PC.

Investor Conference Call

Hope Bancorp previously announced that it will host an investor conference call on Monday, April 29, 2024, at 9:30 a.m. Pacific Time / 6:30 a.m. Hawai‘i Time / 12:30 p.m. Eastern Time to review unaudited financial results for its first quarter ended March 31, 2024. Investors and analysts are invited to access the conference call by dialing 866-235-9917 (domestic) or 412-902-4103 (international) and asking for the “Hope Bancorp Call.” A presentation to accompany the earnings call, along with a presentation regarding the proposed Territorial merger, will be available at the Investor Relations section of Hope Bancorp’s website at www.ir-hopebancorp.com. Other interested parties are invited to listen to a live webcast of the call available at the Investor Relations section of Hope Bancorp’s website. After the live webcast, a replay will remain available at the Investor Relations section of Hope Bancorp’s website for one year. A telephonic replay of the call will be available at 877-344-7529 (domestic) or 412-317-0088 (international) for one week through May 6, 2024, replay access code 4889007.

About Hope Bancorp, Inc.

Hope Bancorp, Inc. (NASDAQ: HOPE) is the holding company of Bank of Hope, the first and only super regional Korean American bank in the United States with $18.09 billion in total assets as of March 31, 2024. Headquartered in Los Angeles, California and serving a multi-ethnic population of customers across the nation, Bank of Hope provides a full suite of commercial, corporate and consumer loans, including commercial and commercial real estate lending, SBA lending, residential mortgage and other consumer lending; deposit and fee-based products and services; international trade financing; cash management services, foreign currency exchange solutions, and interest rate derivative products, among others. Bank of Hope operates 48 full-service branches in California, Washington, Texas, Illinois, New York, New Jersey, Virginia, Alabama, and Georgia. Bank of Hope also operates SBA loan production offices, commercial loan production offices, and residential mortgage loan production offices in the United States; and a representative office in Seoul, Korea. Bank of Hope is a California-chartered bank, and its deposits are insured by the FDIC to the extent provided by law. Bank of Hope is an Equal Opportunity Lender. For additional information, please go to www.bankofhope.com. By including the foregoing website address link, Hope Bancorp does not intend to and shall not be deemed to incorporate by reference any material contained or accessible therein.

About Territorial Bancorp Inc.

Territorial Bancorp Inc. (NASDAQ: TBNK), headquartered in Honolulu, Hawai‘i, is the stock holding company for Territorial Savings Bank. Territorial Savings Bank is a state-chartered savings bank which was originally chartered in 1921 by the Territory of Hawai‘i. Territorial Savings Bank conducts business from its headquarters in Honolulu, Hawai‘i and has 28 branch offices in the state of Hawai‘i. For additional information, please visit Territorial’s website at: https://www.tsbhawaii.bank. By including the foregoing website address link, Territorial does not intend to and shall not be deemed to incorporate by reference any material contained or accessible therein.

Additional Information and Where to Find It

In connection with the proposed merger, Hope Bancorp, Inc. will file with the Securities and Exchange Commission (“SEC”) a Registration Statement on Form S-4, which will include a Proxy Statement of Territorial Bancorp Inc. that also constitutes a prospectus of Hope Bancorp, Inc. Territorial Bancorp shareholders are encouraged to read the Registration Statement and the Proxy Statement/Prospectus regarding the merger when it becomes available and any other relevant documents filed with the SEC, as well as any amendments or supplements to those documents, because they will contain important information about the proposed merger. Territorial Bancorp shareholders will be able to obtain a free copy of the Proxy Statement/Prospectus, as well as other filings containing information about Hope Bancorp and Territorial Bancorp at the SEC’s Internet site (www.sec.gov). Territorial Bancorp shareholders will also be able to obtain these documents, free of charge, from Territorial Bancorp at https://www.tsbhawaii.bank/tsb/investor-relations/.

Participants in Solicitation

Territorial Bancorp and its directors, executive officers, management and employees may be deemed to be participants in the solicitation of proxies in respect of the merger. Information concerning Territorial Bancorp’s participants is set forth in the Proxy Statement, dated April 16, 2024, for Territorial Bancorp’s 2024 annual meeting of shareholders as filed with the SEC on Schedule 14A. Additional information regarding the participants in the solicitation of proxies in respect of the proposed transaction and interests of participants of Territorial Bancorp in the solicitation of proxies in respect of the merger will be included in the Registration Statement and Proxy Statement/Prospectus to be filed with the SEC. Free copies of these documents, when available, may be obtained as described in the preceding paragraph.

Forward-Looking Statements

Some statements in this news release may constitute forward-looking statements within the meaning of Section 27A of the Securities Act of 1933, as amended, and Section 21E of the Securities Exchange Act of 1934, as amended. These forward-looking statements relate to, among other things, expectations regarding the low-cost core deposit base, diversification of the loan portfolio, expansion of market share, capital to support growth, strengthened opportunities, enhanced value, geographic expansion, and statements about the proposed transaction being immediately accretive. Forward-looking statements include, but are not limited to, statements preceded by, followed by or that include the words “will,” “believes,” “expects,” “anticipates,” “intends,” “plans,” “estimates” or similar expressions. With respect to any such forward-looking statements, Hope Bancorp and Territorial Bancorp each claims the protection provided for in the Private Securities Litigation Reform Act of 1995. These statements involve risks and uncertainties. Hope Bancorp’s actual results, performance or achievements may differ significantly from the results, performance or achievements expressed or implied in any forward-looking statements. The closing of the proposed transaction is subject to regulatory approvals, the approval of Territorial Bancorp shareholders, and other customary closing conditions. There is no assurance that such conditions will be met or that the proposed merger will be consummated within the expected time frame, or at all. If the transaction is consummated, factors that may cause actual outcomes to differ from what is expressed or forecasted in these forward-looking statements include, among things: difficulties and delays in integrating Hope Bancorp and Territorial Bancorp and achieving anticipated synergies, cost savings and other benefits from the transaction; higher than anticipated transaction costs; deposit attrition, operating costs, customer loss and business disruption following the merger, including difficulties in maintaining relationships with employees and customers, may be greater than expected; and required governmental approvals of the merger may not be obtained on its proposed terms and schedule, or without regulatory constraints that may limit growth. Other risks and uncertainties include, but are not limited to: possible further deterioration in economic conditions in Hope Bancorp’s or Territorial Bancorp’s areas of operation or elsewhere; interest rate risk associated with volatile interest rates and related asset-liability matching risk; liquidity risks; risk of significant non-earning assets, and net credit losses that could occur, particularly in times of weak economic conditions or times of rising interest rates; the failure of or changes to assumptions and estimates underlying Hope Bancorp’s or Territorial Bancorp’s allowances for credit losses; potential increases in deposit insurance assessments and regulatory risks associated with current and future regulations; the outcome of any legal proceedings that may be instituted against Hope Bancorp or Territorial Bancorp; the risk that any announcements relating to the proposed transaction could have adverse effects on the market price of the common stock of either or both parties to the proposed transaction; and diversion of management’s attention from ongoing business operations and opportunities. For additional information concerning these and other risk factors, see Hope Bancorp’s and Territorial Bancorp’s most recent Annual Reports on Form 10-K. Hope Bancorp and Territorial Bancorp do not undertake, and specifically disclaim any obligation, to update any forward-looking statements to reflect the occurrence of events or circumstances after the date of such statements except as required by law.

Contacts

For Hope Bancorp, Inc.:
Julianna Balicka

EVP & Chief Financial Officer

213-235-3235

julianna.balicka@bankofhope.com

Angie Yang

SVP, Director of Investor Relations &

Corporate Communications

213-251-2219

angie.yang@bankofhope.com

For Territorial Bancorp Inc.
Walter Ida

SVP, Director of Investor Relations

808-946-1400

walter.ida@territorialsavings.net

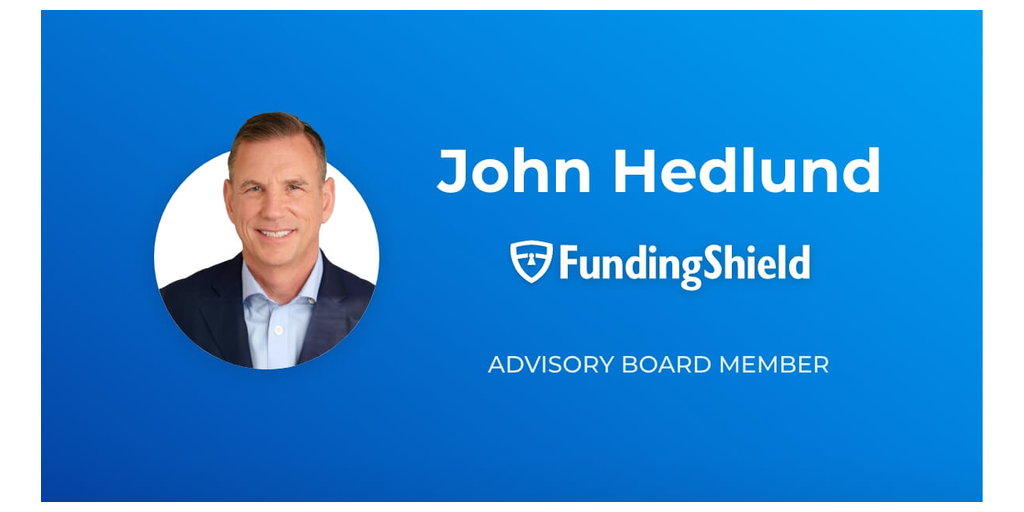
John Hedlund, Mortgage Industry Veteran and Operations Leader, Joins FundingShield Advisory Board

John Hedlund, Mortgage Industry Veteran and Operations Leader, Joins FundingShield Advisory Board


John Hedlund, Mortgage Industry Veteran and Operations Leader, Joins FundingShield Advisory Board

NEWPORT BEACH, Calif.–(BUSINESS WIRE)–#compliancemanagementFundingShield is pleased to announce that John Hedlund has joined its advisory board.


John Hedlund, founder of Adanac Advisory Group (AAG), a boutique advisory and consulting firm, recently retired from AmeriHome Mortgage, a Western Alliance Bank Company where John was Chief Operating Officer and Managing Director. John was one of the original founders (2013) of AmeriHome and helped lead the sale to Western Alliance Bank in 2021. AmeriHome quickly grew from inception to become the 2nd largest Correspondent Lender in the United States (2022 – $78B, 2023 – $43B and ~$80B in Servicing). Apollo Global Management, Inc. (NYSE: APO) (together with its consolidated subsidiaries, “Apollo”), Athene Holding Ltd. (NYSE: ATH) (“Athene”), and AmeriHome Mortgage Company, LLC, completed the sale of AmeriHome to Western Alliance Bank in April 2021 where John was a member of the leadership and executive team. John led and was responsible for all production businesses at AmeriHome Mortgage.

FundingShield’s CEO & Chairman Ike Suri shared, “John is an experienced operator, seasoned executive and has a history in guiding large financial institutions through change, including in optimizing the use of technology. We look forward to working with him to accomplish additional growth for FundingShield leveraging his experience, his accomplishments, and the reach of his network.”

John shared, “I am excited to join FundingShield as an Advisory Board Member and to join in their journey in tackling some of the most challenging and timely issues in the Financial Industry such as cyber security, payment risk, fraud and protecting lenders and consumers.”

Prior to his leadership roles at AmeriHome for the last 11 years John spent 7 years as an executive with Bank of America Home Loans, joining Bank of America (previously Countrywide) in 2007 as Executive Vice President of Correspondent Lending Operations. He began his career with the Royal Bank of Canada and relocated to the United States in 2002 as Chief Operating Officer of RBC Mortgage.

John is an experienced business executive specializing in strategic design, execution, and leadership of large, diverse financial services organizations. He has successfully led numerous businesses through major transformational changes over the past 30 years, displaying a unique ability to drive sustainable revenue growth and cost reductions through innovation, while fostering a loyal and cohesive leadership team.

John has served as a Board Member for several firms and organizations, currently he is Chairman of the Board for MISMO, Advisory Board Member for Automated Mortgage Systems, Inc. (Mortgage Servicing FinTech), Board member of the Mortgage Bankers Association, and Board Director of the California Mortgage Bankers Association.

John is highly regarded for his unique perspective, understanding of the mortgage market from the origination, correspondent and capital markets perspectives and has the ability to lead teams to success.

Contacts

Media Inquires and to learn more about our firm:

FundingShield

+1 949-706-7888

Info@fundingshield.com

Visit us on social media:

LinkedIn
Facebook
Twitter

www.fundingshield.com

Hope Bancorp Reports 2024 First Quarter Financial Results; Signs Definitive Merger With Territorial Bancorp

Hope Bancorp Reports 2024 First Quarter Financial Results; Signs Definitive Merger With Territorial Bancorp


Hope Bancorp Reports 2024 First Quarter Financial Results; Signs Definitive Merger With Territorial Bancorp

LOS ANGELES–(BUSINESS WIRE)–Hope Bancorp, Inc. (“Company”) (NASDAQ: HOPE), the holding company of Bank of Hope (“Bank”), today reported unaudited financial results for its first quarter ended March 31, 2024. For the three months ended March 31, 2024, net income totaled $25.9 million, or $0.21 per diluted common share. This compares with net income of $26.5 million, or $0.22 per diluted common share, in the fourth quarter of 2023.

“We are pleased with the progress we are making in our strategic transformation, realigning our structure around lines of business and products,” stated Kevin S. Kim, Chairman, President and Chief Executive Officer. “All our business lines exceeded their deposit goals for the first quarter of 2024; growth in customer deposits offset a planned reduction of brokered time deposits, resulting in stable balances quarter-over-quarter. Our first quarter financial results demonstrated the benefits of our more efficient structure with noninterest expenses, excluding notable items(1), decreasing 2% from the preceding fourth quarter of 2023. All our capital ratios increased quarter-over-quarter, with our tangible common equity ratio(2) rising to 9.33% and our total capital ratio rising to 14.19%, both as of March 31, 2024.

“The strength of our balance sheet positioned us well to capitalize on strategic opportunities in the market. This morning, we announced the signing of a definitive merger agreement with Territorial Bancorp, the stock holding company of Territorial Savings Bank, a $2.2 billion savings bank headquartered in Hawai‘i,” continued Kim. “Territorial has a stable, low-cost core deposit base, excellent asset quality, and provides us an entry point to the attractive Hawai‘i market, which has a large Asian American and Pacific Islander population. Moreover, the combination with Territorial would more than double the size of Hope’s residential mortgage portfolio. We expect this transaction, upon completion, to be immediately accretive to earnings, sustainably strengthening our profitability while further diversifying our franchise.”

_____________________________________

(1)

Noninterest expense, excluding the FDIC special assessment, restructuring charges and merger-related expenses (also referred to collectively as the “notable items”), is a non-GAAP financial measure. Quantitative reconciliations of the most directly comparable GAAP to non-GAAP financial measures are provided in the accompanying financial information on Table Pages 9 and 10.

(2)

Tangible common equity (“TCE”) ratio is a non-GAAP financial measure. Quantitative reconciliations of the most directly comparable GAAP to non-GAAP financial measures are provided in the accompanying financial information on Table Pages 9 and 10.

Territorial Bancorp Merger Agreement

As concurrently announced in a joint news release issued today, the Company and Territorial Bancorp Inc. (Nasdaq: TBNK) (“Territorial”) signed a definitive merger agreement, which is expected to create the largest regional bank catering to multi-ethnic customers with full-service branches across the continental United States and Hawai‘i.

Under the terms of the merger agreement, following the completion of the transaction, Territorial shareholders will receive a fixed exchange ratio of 0.8048 shares of the Company’s common stock in exchange for each share of Territorial common stock they own, in a 100% stock-for-stock transaction valued at approximately $78.6 million. Based on the closing price of the Company’s common stock on April 26, 2024, this represents a value of $8.82 per share of Territorial common stock, although the actual value will be determined upon transaction closing. Upon completion of the transaction, it is expected that the Company’s shareholders will own approximately 94.4% of the combined entity, and Territorial’s shareholders will own approximately 5.6%, with the actual percentages being determined as of the transaction closing date. The transaction is intended to qualify as a tax-free reorganization for Territorial shareholders.

Upon completion of the merger, the Company intends to preserve and build upon the 100-plus year legacy of the Territorial Savings Bank brand name, culture and commitment to its local communities. Accordingly, the legacy Territorial franchise in Hawai‘i will continue to do business under the Territorial Savings Bank brand, as a trade name of Bank of Hope.

The Boards of Directors of both companies have approved the transaction. The transaction is expected to close by year-end 2024, subject to regulatory approvals, the approval of Territorial shareholders, and the satisfaction of other customary closing conditions.

Operating Results for the 2024 First Quarter

Net income and earnings per share. Net income for the 2024 first quarter was $25.9 million, or $0.21 per diluted common share, compared with $26.5 million, or $0.22 per diluted common share, for the immediately preceding fourth quarter. Notable items impacting net income for the 2024 first quarter included $752,000 of merger-related expenses, after tax, related to the Company’s proposed acquisition of Territorial announced today; an accrual of $721,000, after tax, for an incremental Federal Deposit Insurance Corporation (“FDIC”) special assessment; and restructuring costs of $103,000, after tax, related to the Company’s strategic reorganization announced in the 2023 fourth quarter. In the immediately preceding fourth quarter, notable items impacting net income were $8.7 million of restructuring costs, after tax, and $3.1 million, after tax, accrued for an FDIC special assessment. Excluding these notable items, net income(3) for the 2024 first quarter was $27.4 million, compared with $38.3 million for the fourth quarter of 2023. Earnings per diluted common share excluding notable items(3) amounted to $0.23 for the three months ended March 31, 2024, compared with $0.32 for the three months ended December 31, 2023.

Net interest income and net interest margin. Net interest income before provision for credit losses for the 2024 first quarter totaled $115.0 million, compared with $125.9 million in the immediately preceding fourth quarter, a decrease of 9% quarter-over-quarter. First quarter 2024 net interest margin contracted 15 basis points to 2.55% from 2.70% in the 2023 fourth quarter. The linked-quarter change in net interest income and net interest margin largely reflected a decline in the average balance of loans and a higher cost of interest bearing deposits, partially offset by a decrease in the average balance of time deposits and wholesale borrowings.

Noninterest income. Noninterest income for the 2024 first quarter totaled $8.3 million, compared with $9.3 million in the immediately preceding fourth quarter. Growth in deposit account service fees was offset by reductions in other income and fees. The Company continued to retain SBA 7(a)loan production on its balance sheet and did not sell any loans in the 2024 first quarter.

Noninterest expense. Noninterest expense for the 2024 first quarter was $84.8 million, including $1.0 million of merger-related expenses, an incremental accrual of $1.0 million for the FDIC special assessment, and $143,000 of restructuring-related costs, all on a pre-tax basis. For the immediately preceding fourth quarter, noninterest expense was $99.2 million, including $11.1 million of pre-tax restructuring costs and $4.0 million (pre-tax) accrued for the FDIC special assessment.

Excluding notable items, noninterest expense for the 2024 first quarter was $82.7 million, down 2% compared with $84.1 million for the 2023 fourth quarter, and down 7% compared with $88.7 million for the 2023 first quarter. First quarter 2024 salaries and employee benefits expense increased 1% quarter-over-quarter to $47.8 million, up from $47.4 million in the 2023 fourth quarter, reflecting seasonal increases in payroll taxes and vacation accruals, partially offset by reduced salary and benefits costs following the restructuring in the fourth quarter of 2023. Year-over-year, salaries and employee benefits expense decreased 16% from $57.2 million in the 2023 first quarter. Occupancy expenses decreased 6% quarter-over-quarter and 10% year-over-year, reflecting branch rationalization.

Tax rate. The effective tax rate for the 2024 first quarter was 27.9%, compared with 24.9% for the full year 2023. The provision for income taxes in the 2024 first quarter was $10.0 million and included $1.1 million of true-up adjustments, which are not expected to recur. For the full year 2024, the Company expects the effective tax rate to be approximately 26%.

_____________________________________

(3)

Net income excluding notable items and earnings per diluted common share excluding notable items are non-GAAP financial measures. Quantitative reconciliations of the most directly comparable GAAP to non-GAAP financial measures are provided in the accompanying financial information on Table Pages 9 and 10.

Balance Sheet Summary

Cash and investment securities. At March 31, 2024, cash and cash equivalents totaled $1.19 billion, compared with $1.93 billion at December 31, 2023. The decrease primarily reflected the payoff of $1.00 billion of the Company’s Bank Term Funding Program (“BTFP”) borrowings with existing cash on March 19, 2024. At March 31, 2023, cash and equivalents were $2.21 billion. Investment securities totaled $2.28 billion at March 31, 2024, $2.41 billion at December 31, 2023, and $2.23 billion at March 31, 2023.

Loans. Loans receivable of $13.72 billion at March 31, 2024, decreased 1% from $13.85 billion at December 31, 2023, reflecting declines in commercial and commercial real estate loans, partially offset by strong growth in residential mortgage loans.

The following table sets forth the loan portfolio composition at March 31, 2024, December 31, 2023, and March 31, 2023:

(dollars in thousands) (unaudited)

3/31/2024


12/31/2023


3/31/2023


Balance


Percentage


Balance


Percentage


Balance


Percentage

Commercial real estate (“CRE”) loans

$

8,707,673

63.5

%


$

8,797,884


63.6

%


$

9,373,529


62.2

%

Commercial and industrial (“C&I”) loans


4,041,063


29.5

%


4,135,044


29.8

%


4,821,270


32.0

%

Residential mortgage and other loans


970,442


7.0

%


920,691


6.6

%


870,050


5.8

%

Loans receivable

$

13,719,178


100.0

%


$

13,853,619


100.0

%


$

15,064,849


100.0

%

Deposits. Total deposits were stable quarter-over-quarter with total deposits of $14.75 billion at March 31, 2024 and December 31, 2023, reflecting growth in customer deposits that offset a planned reduction of brokered deposits. During the first quarter of 2024, the Company reduced brokered time deposits by $182.7 million, or 13% from December 31, 2023.

The following table sets forth the deposit composition at March 31, 2024, December 31, 2023, and March 31, 2023:

(dollars in thousands) (unaudited)

3/31/2024


12/31/2023


3/31/2023


Balance


Percentage


Balance


Percentage


Balance


Percentage

Noninterest bearing demand deposits

$

3,652,592


24.7

%


$

3,914,967


26.5

%


$

4,504,621


28.4

%

Money market, interest bearing demand, and savings deposits


5,313,064


36.0

%


4,872,029


33.0

%


4,563,702


28.9

%

Time deposits


5,787,761


39.3

%


5,966,757


40.5

%


6,759,886


42.7

%

Total deposits

$

14,753,417


100.0

%


$

14,753,753


100.0

%


$

15,828,209


100.0

%


Gross loan-to-deposit ratio


93.0

%


93.9

%


96.0

%

Borrowings. Federal Home Loan Bank and Federal Reserve Bank borrowings totaled $795.6 million at March 31, 2024, $1.80 billion at December 31, 2023, and $2.13 billion at March 31, 2023. The quarter-over-quarter reduction reflects the payoff of $1.00 billion of the Company’s BTFP borrowings during the 2024 first quarter.

Credit Quality and Allowance for Credit Losses

Nonperforming assets. Nonperforming assets totaled $106.8 million, or 0.59% of total assets, at March 31, 2024. This compares with nonperforming assets of $45.5 million, or 0.24% of total assets, at December 31, 2023, and $80.2 million, or 0.39% of total assets, at March 31, 2023. The quarter-over-quarter increase in nonperforming assets largely reflects one relationship consisting of three commercial real estate loans that were accruing delinquent loans past due 90 days or more at March 31, 2024. These loans are fully secured and sales agreements are in place for the collateral properties.

The following table sets forth the components of nonperforming assets at March 31, 2024, December 31, 2023, and March 31, 2023:

(dollars in thousands) (unaudited)

3/31/2024


12/31/2023


3/31/2023

Loans on nonaccrual status (1)

$

59,526


$

45,204


$

78,861


Accruing delinquent loans past due 90 days or more


47,290


261


364


Total nonperforming loans


106,816


45,465


79,225


Other real estate owned


63


938


Total nonperforming assets

$

106,816


$

45,528


$

80,163


Nonperforming assets/total assets


0.59

%


0.24

%


0.39

%

_____________________________________

(1)

Excludes delinquent SBA loans that are guaranteed and currently in liquidation totaling $10.9 million, $11.4 million and $7.6 million at March 31, 2024, December 31, 2023, and March 31, 2023, respectively.

Net charge offs and provision for credit losses. The Company recorded net charge offs of $3.5 million in the 2024 first quarter, equivalent to 0.10%, annualized, of average loans. This compares with net charge offs of $1.8 million, or 0.05%, annualized, of average loans in the immediately preceding fourth quarter.

The following table sets forth net charge offs and annualized net charge off ratios for the three months ended March 31, 2024, December 31, 2023, and March 31, 2023:


For the Three Months Ended

(dollars in thousands) (unaudited)

3/31/2024


12/31/2023


3/31/2023

Net charge offs

$

3,536


$

1,815


$

108


Net charge offs/average loans receivable (annualized)


0.10

%


0.05

%


%

For the 2024 first quarter, the Company recorded a provision for credit losses of $2.6 million. This compares with a provision for credit losses of $2.4 million in the immediately preceding fourth quarter.

Allowance for credit losses. The allowance for credit losses totaled $158.8 million at March 31, 2024, compared with $158.7 million at December 31, 2023. The allowance coverage ratio was 1.16% of loans receivable at March 31, 2024, up one basis point from 1.15% at December 31, 2023. Year-over-year, allowance coverage of loans receivable increased from 1.09% at March 31, 2023.

The following table sets forth the allowance for credit losses and the coverage ratios at March 31, 2024, December 31, 2023, and March 31, 2023:

(dollars in thousands) (unaudited)

3/31/2024


12/31/2023


3/31/2023

Allowance for credit losses

$

158,758


$

158,694


$

163,544


Allowance for credit losses/loans receivable


1.16

%


1.15

%


1.09

%

Capital

The Company’s capital ratios are strong and all regulatory risk-based capital ratios expanded quarter-over-quarter and year-over-year. At March 31, 2024, the Company and the Bank continued to exceed all regulatory capital requirements generally required to meet the definition of a “well-capitalized” financial institution. The following table sets forth the capital ratios for the Company at March 31, 2024, December 31, 2023, and March 31, 2023:

(unaudited)

3/31/2024


12/31/2023


3/31/2023


Minimum Guideline
for “Well-Capitalized”

Common Equity Tier 1 Capital Ratio

12.47

%


12.28

%


10.75

%


6.50

%

Tier 1 Capital Ratio

13.17

%


12.96

%


11.36

%


8.00

%

Total Capital Ratio

14.19

%


13.92

%


12.25

%


10.00

%

Leverage Ratio

10.42

%


10.11

%


10.13

%


5.00

%

At March 31, 2024, total stockholders’ equity was $2.11 billion, or $17.51 per common share. Quarter-over-quarter, stockholders’ equity decreased slightly by $9.0 million, primarily reflecting an adverse change in accumulated other comprehensive income (“AOCI”), partially offset by growth in retained earnings. Tangible common equity (“TCE”) per share(1) was $13.63 at March 31, 2024, compared with $13.76 at December 31, 2023, and the TCE ratio(1) was 9.33%, up 47 basis points quarter-over-quarter.

The following table sets forth the TCE per share and the TCE ratio at March 31, 2024, December 31, 2023, and March 31, 2023:

(unaudited)

3/31/2024


12/31/2023


3/31/2023

TCE per share (1)

$

13.63


$

13.76


$

13.26


TCE ratio (1)


9.33

%


8.86

%


7.91

%

_____________________________________

(1)

TCE per share and TCE ratio are non-GAAP financial measures. Quantitative reconciliations of the most directly comparable GAAP to non-GAAP financial measures are provided in the accompanying financial information on Table Pages 9 and 10.

Investor Conference Call

The Company previously announced that it will host an investor conference call on Monday, April 29, 2024, at 9:30 a.m. Pacific Time / 12:30 p.m. Eastern Time to review unaudited financial results for its first quarter ended March 31, 2024. Investors and analysts are invited to access the conference call by dialing 866-235-9917 (domestic) or 412-902-4103 (international) and asking for the “Hope Bancorp Call.” A presentation to accompany the earnings call, along with a presentation regarding the proposed Territorial merger, will be available at the Investor Relations section of Hope Bancorp’s website at www.ir-hopebancorp.com. Other interested parties are invited to listen to a live webcast of the call available at the Investor Relations section of Hope Bancorp’s website. After the live webcast, a replay will remain available at the Investor Relations section of Hope Bancorp’s website for at least one year. A telephonic replay of the call will be available at 877-344-7529 (domestic) or 412-317-0088 (international) for one week through May 6, 2024, replay access code 4889007.

Non-GAAP Financial Metrics

This news release and accompanying financial tables contain certain non-GAAP financial measure disclosures, including net income excluding notable items, earnings per share excluding notable items, noninterest expense excluding notable items, TCE per share, TCE ratio, ROA excluding notable items, ROE excluding notable items, ROTCE, ROTCE excluding notable items, efficiency ratio excluding notable items and noninterest expense / average assets excluding notable items. Management believes these non-GAAP financial measures provide meaningful supplemental information regarding the Company’s operational performance and the Company’s capital levels and has included these figures in response to market participant interest in these financial metrics. Quantitative reconciliations of the most directly comparable GAAP to non-GAAP financial measures are provided in the accompanying financial information on Table Pages 9 and 10.

About Hope Bancorp, Inc.

Hope Bancorp, Inc. (NASDAQ: HOPE) is the holding company of Bank of Hope, the first and only super regional Korean American bank in the United States with $18.09 billion in total assets as of March 31, 2024. Headquartered in Los Angeles and serving a multi-ethnic population of customers across the nation, the Bank provides a full suite of commercial, corporate and consumer loans, including commercial and commercial real estate lending, SBA lending, residential mortgage and other consumer lending; deposit and fee-based products and services; international trade financing; cash management services, foreign currency exchange solutions, and interest rate derivative products, among others. Bank of Hope operates 48 full-service branches in California, Washington, Texas, Illinois, New York, New Jersey, Virginia, Alabama, and Georgia. The Bank also operates SBA loan production offices, commercial loan production offices, and residential mortgage loan production offices in the United States; and a representative office in Seoul, Korea. Bank of Hope is a California-chartered bank, and its deposits are insured by the FDIC to the extent provided by law. Bank of Hope is an Equal Opportunity Lender. For additional information, please go to www.bankofhope.com. By including the foregoing website address link, the Company does not intend to and shall not be deemed to incorporate by reference any material contained or accessible therein.

About Territorial Bancorp Inc.

Territorial Bancorp Inc. (NASDAQ: TBNK), headquartered in Honolulu, Hawai‘i, is the stock holding company for Territorial Savings Bank. Territorial Savings Bank is a state-chartered savings bank which was originally chartered in 1921 by the Territory of Hawai‘i. Territorial Savings Bank conducts business from its headquarters in Honolulu, Hawai‘i and has 28 branch offices in the state of Hawai‘i. For additional information, please visit Territorial’s website at: https://www.tsbhawaii.bank. By including the foregoing website address link, Territorial does not intend to and shall not be deemed to incorporate by reference any material contained or accessible therein.

Additional Information and Where to Find It

In connection with the proposed merger, Hope Bancorp, Inc. will file with the Securities and Exchange Commission (“SEC”) a Registration Statement on Form S-4, which will include a Proxy Statement of Territorial Bancorp Inc., that also constitutes a prospectus of Hope Bancorp, Inc. Territorial Bancorp shareholders are encouraged to read the Registration Statement and the Proxy Statement/Prospectus regarding the merger when it becomes available and any other relevant documents filed with the SEC, as well as any amendments or supplements to those documents, because they will contain important information about the proposed merger. Territorial Bancorp shareholders will be able to obtain a free copy of the Proxy Statement/Prospectus, as well as other filings containing information about Hope Bancorp and Territorial Bancorp at the SEC’s Internet site (www.sec.gov). Territorial Bancorp shareholders will also be able to obtain these documents, free of charge, from Territorial Bancorp at https://www.tsbhawaii.bank/tsb/investor-relations/.

Participants in Solicitation

Territorial Bancorp and its directors, executive officers, management and employees may be deemed to be participants in the solicitation of proxies in respect of the merger. Information concerning Territorial Bancorp’s participants is set forth in the Proxy Statement, dated April 16, 2024, for Territorial Bancorp’s 2024 annual meeting of stockholders as filed with the SEC on Schedule 14A. Additional information regarding the interests of participants of Territorial Bancorp in the solicitation of proxies in respect of the merger will be included in the Registration Statement and Proxy Statement/Prospectus to be filed with the SEC.

Forward-Looking Statements

Some statements in this news release may constitute forward-looking statements within the meaning of Section 27A of the Securities Act of 1933, as amended, and Section 21E of the Securities Exchange Act of 1934, as amended. These forward-looking statements relate to, among other things, expectations regarding Territorial Bancorp’s low-cost core deposit base, strengthening of profitability, diversification of franchise, and statements about the proposed transaction being immediately accretive. Forward-looking statements include, but are not limited to, statements preceded by, followed by or that include the words “will,” “believes,” “expects,” “anticipates,” “intends,” “plans,” “estimates” or similar expressions.

Contacts

Julianna Balicka

EVP & Chief Financial Officer

213-235-3235

julianna.balicka@bankofhope.com

Angie Yang

SVP, Director of Investor Relations & Corporate Communications

213-251-2219

angie.yang@bankofhope.com

Read full story here